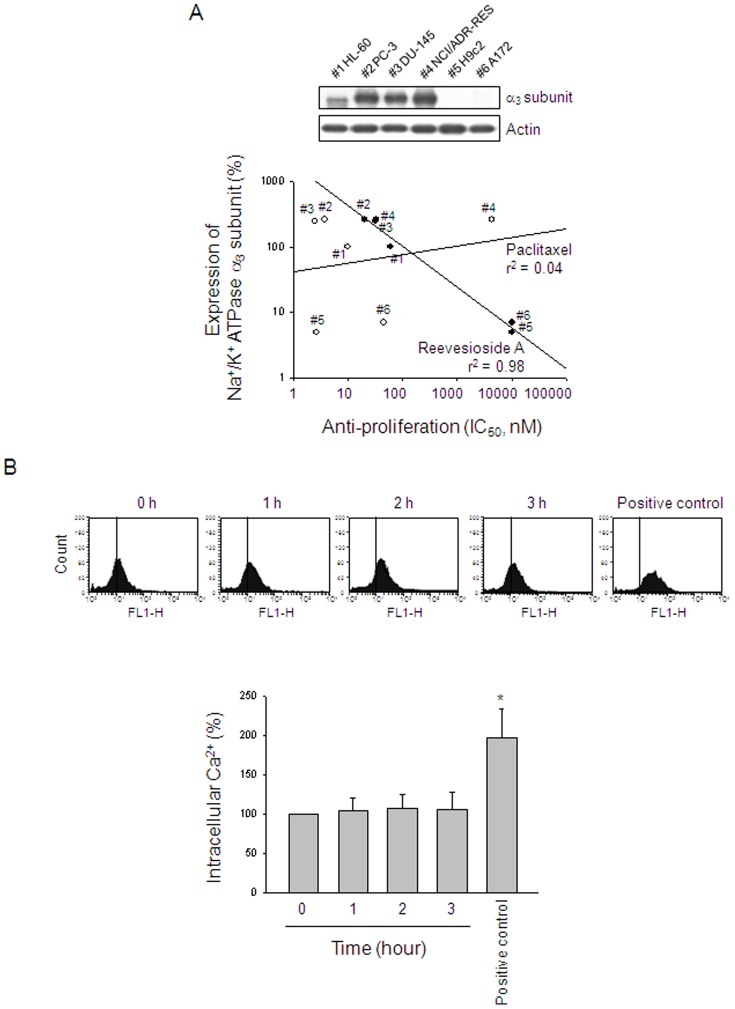
Figure 7. Correlation between Na+/K+-ATPase α3 subunit and anti-proliferative activity.
(A) The expression of Na+/K+-ATPase α3 subunit was detected using Western blot analysis. The anti-proliferative IC50 values were determined using SRB assays except for HL-60 cells by MTT assays. (B) PC-3 cells were incubated in the absence or presence of reevesioside A (50 nM) for the indicated times. After the treatment, the cells were harvested for the detection of intracellular Ca2+ levels using flow cytometric analysis of the staining with fluo-3 AM. Data are expressed as mean±SEM of three independent experiments. * P<0.05 compared with the control.

