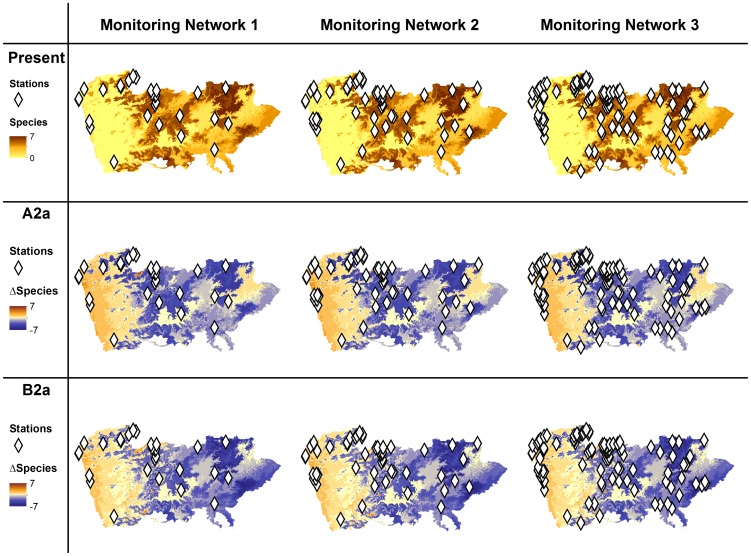
Figure 5. Sampling stations for the proposed monitoring networks (MN1, MN2 and MN3).
Sampling stations for the proposed monitoring networks (MN1, MN2 and MN3) showing the present predicted species richness according to climatic model and predicted variation in climatic space between the present and the future under two climatic scenarios (A2a and B2a) for the year 2080. Negative ▵Species values indicate loss of climatic suitable space while positive indicate species gain of climatic suitable space.

