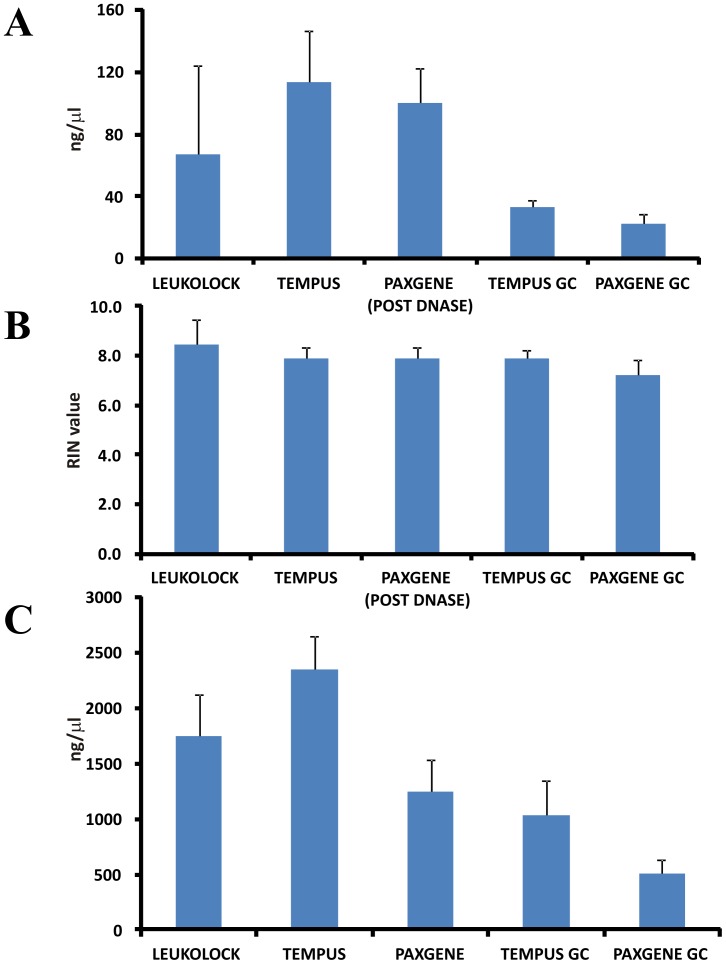
Figure 3. RNA quality and quantity, pre and post in vitro transcription.
Diagrams showing averages of all samples in the extent of yield from the 5 experimental conditions (with standard deviation) for (A) RNA extracted, and (C) aRNA produced post IVT, as well as (B) average RIN values of extracted RNA.

