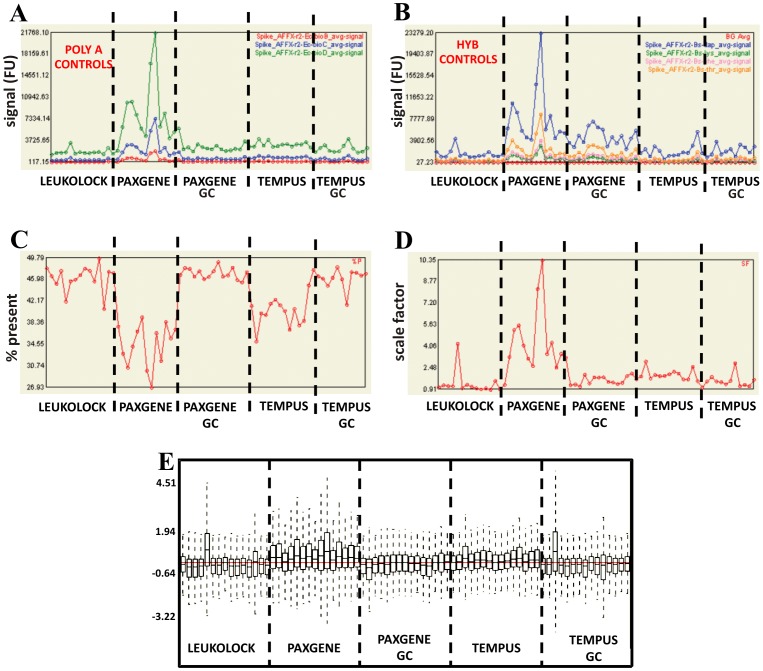
Figure 5. Initial quality control for the 75 microarrays.
Analysis of array data of all 75 samples run was carried out in Affymetrix Expression Console. PolyA (A) and Hyb (B) controls show that the preparation steps were consistent, and that in general all hybridisations were consistent, but that hybridisation of PAX samples differed from the rest. The % present call (C) values were generally consistent in LL, TEM GC and PAX GC samples, but were clearly lower with TEM and PAX gene samples. The scale factor between chips were generally low, except for PAX hybridisations (D) while the relative log expression (E) of all chips were generally similar with a few exceptions, and a slight general increase in PAX samples (FU, fluorescent units).

