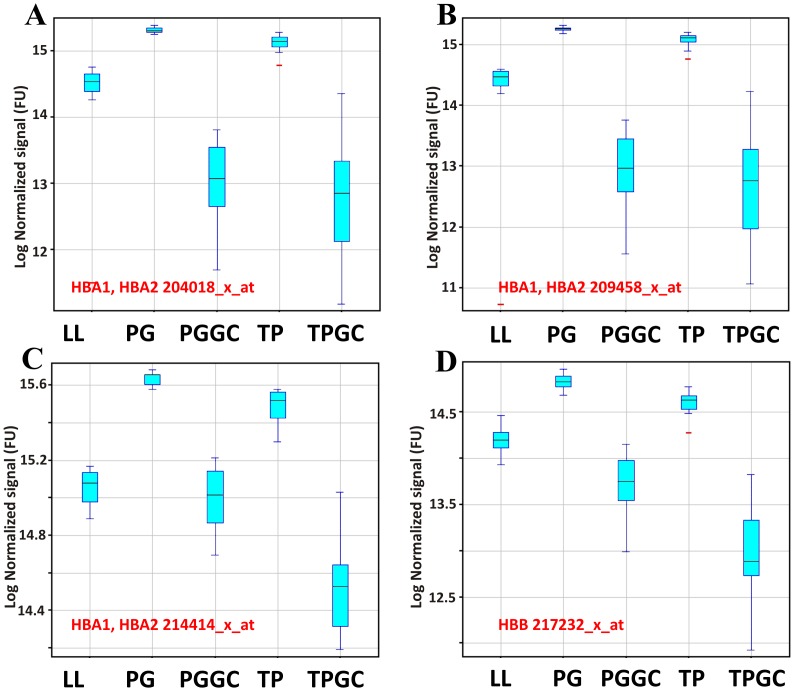
Figure 6. Quality control: globin levels in arrays.
Data were GCRMA normalised and levels of 3 representative alpha globin probe sets (A, B and C) and one beta probe set (D) were averaged for each condition. Expression level box plots indicate that in both the cases of alpha and beta globin, TEM and PAX exhibit highest levels of globin mRNA while TEM GC and PAX GC were the lowest, LL levels were generally lower than PAX and TEM, but higher than PAX GC and TEM GC.

