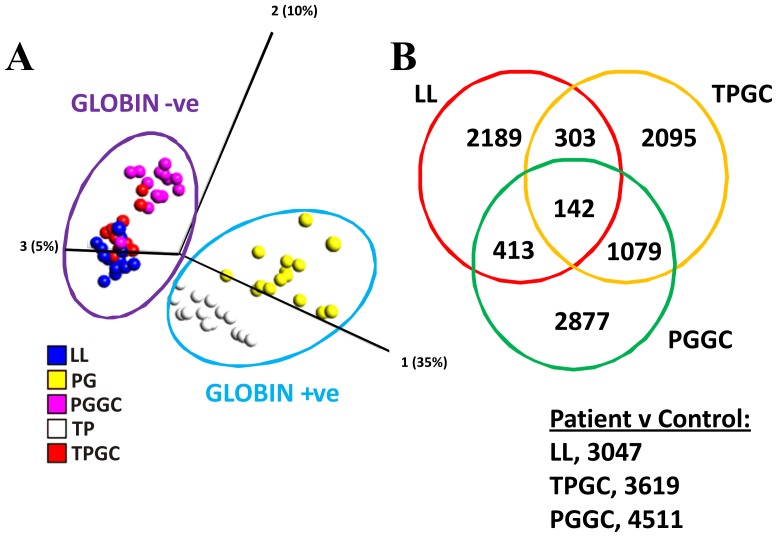
Figure 8. Gene expression analysis.
PCA plotted using QLUCORE OMICS Explorer on GCRMA normalised data: each dot represents an array and takes into account the expression levels of every probe set and shows 2 main clusters (A). One tightly clustering ‘globin negative’ cluster includes the following conditions: LL, TEM GC and PAX GC, while a second more variable cluster “globin positive” includes arrays hybridised with PAX and TEM extracted RNA. Focusing on the globin negative group PUMA analysis identified differentially regulated probe sets (ALS patients vs controls) for the following (B; LL, 3047; TEM GC, 3619; PAX GC, 4511). A Venn diagram comparing these lists shows that TEM and PAX share more genes in common, than either with LL, and 142 genes in common between all 3 methods).

