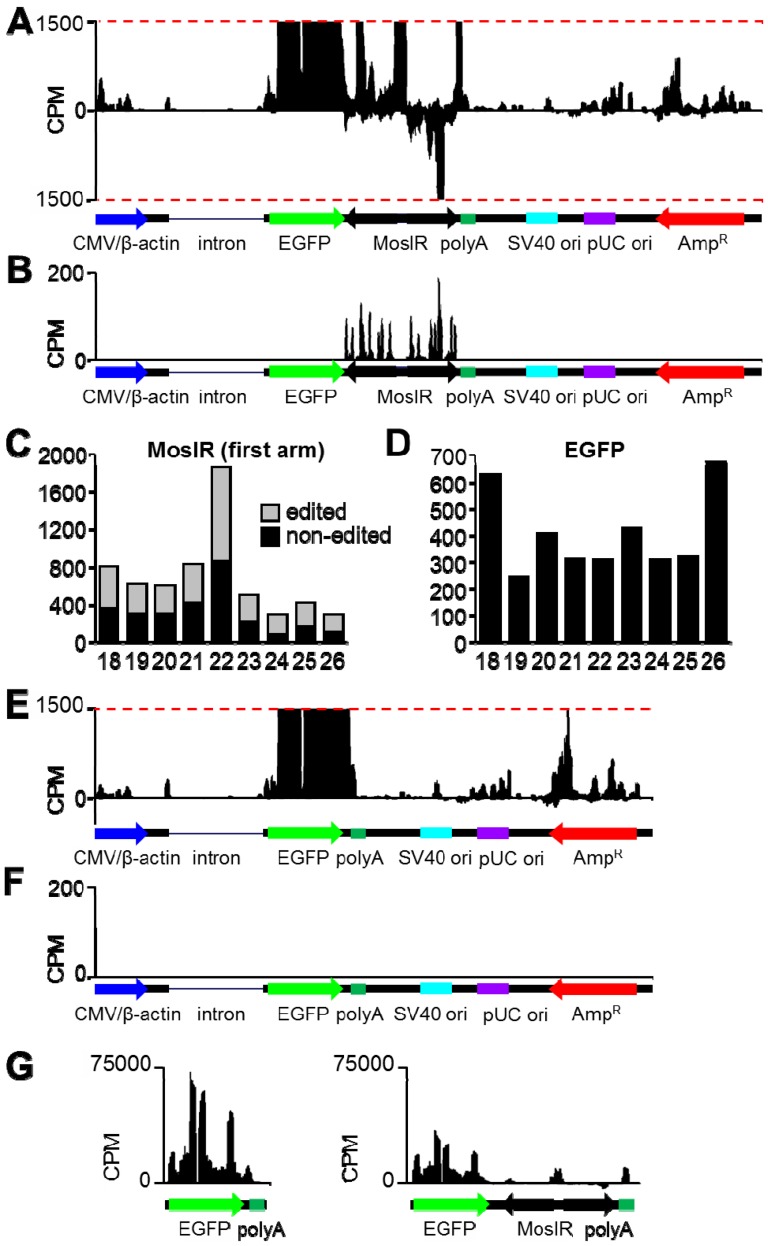
Figure 3. High-throughput sequencing analysis of total RNAs derived from pCAGEGFP and pCAGEGFP-MosIR plasmids.
(A) Distribution of 18–50 nt reads that perfectly map to pCAGEGFP-MosIR. Reads mapping to the sense and antisense strands are shown in the upper and lower half of the graph, respectively. Schematic representation of plasmid features is shown below the histogram. The Y-scale represents normalized read density (counts per million, CPM); y-scale maximum corresponds to 1500 CPM to better visualize RNAs produced from the plasmid backbone. Expression from the CMV/β-actin promoter, which yields normalized read density highly exceeding 1500 CPM, can be seen in the panel G. (B) Distribution of reads 20–24 nt in length with up to 5 adenosine-to-guanosine mismatches that map to pCAGEGFP-MosIR. The Y-scale represents normalized read density (counts per million, CPM); y-scale maximum corresponds to 200 CPM. Schematic representation of plasmid features is shown below the histogram. (C, D) Length distribution of edited (gray) and non-edited (black) reads derived from MosIR (C) or EGFP (D) region of pCAGEGFP-MosIR. (E) Distribution of 18–50 nt reads that perfectly map to pCAGEGFP. Description as in the panel a. (F) Distribution of reads 20–24 nt in length with up to 5 adenosine-to-guanosine mismatches that perfectly to pCAGEGFP. Description as in the panel B. (G) Comparison of normalized read density for pCAGEGFP and pCAGEGFP-MosIR transcripts transcribed from the CMV/β-actin promoter. The Y-scale represents normalized read density (counts per million, CPM); y-scale maximum corresponds to 75000 CPM. Schematic representation each transcript is shown below each histogram.

