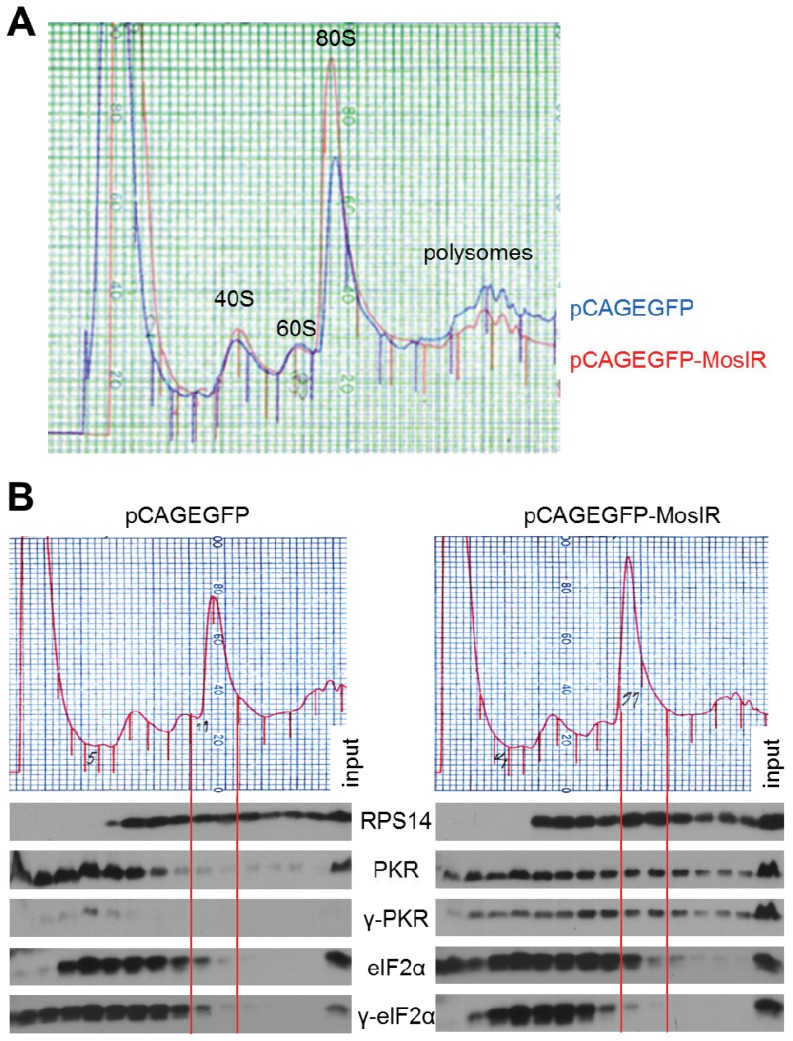
Figure 7. pCAGEGFP-MosIR expression affects the distribution of PKR and its phosphorylated form in polyribosome analysis.
(A) Overlay of polysome profiles from HEK-293 cells transfected with either pCAGEGFP or pCAGEGFP-MosIR. (B) Polysome profile (upper part) and western blotting analysis (lower part) of respective fractions. The alignment of fractions on polysome profile and lanes on western blotting is highlighted by solid red lines flanking fractions 11 and 12. HEK-293 cells transfected with either pCAGEGFP or pCAGEGFP-MosIR were subjected to polysome profiling. Proteins were isolated from each fraction by ethanol precipitation and the same volume aliquots from each fraction were analyzed by polyacrylamide gel electrophoresis and western blotting. The last lane in each sample represents 1% of input. γ, phosphorylated form of protein; RPS14, ribosomal protein S14. The experiment was repeated three times, a representative result is shown.

