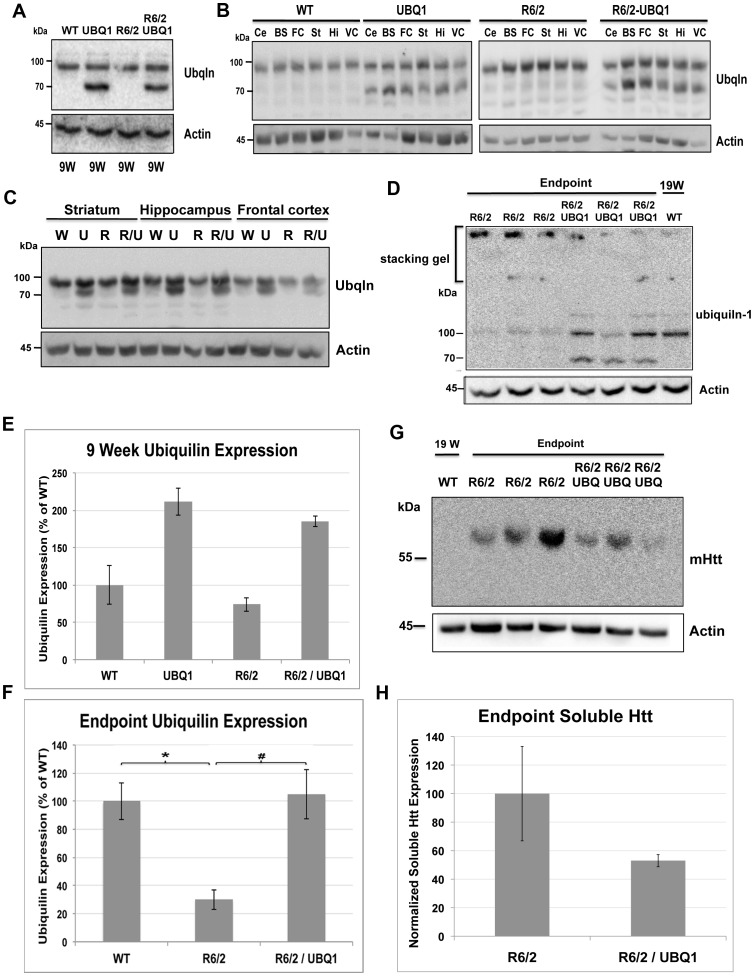
Figure 3. Restoration of ubiquilin levels in animals carrying the R6/2 transgene and accompanying changes in htt protein levels.
(A) Immunoblots of lysates made from dissected brain regions of 9 week-old mice with different genotypes obtained after crossing UBQ1 transgenic mice with R6/2 mice and probed for ubiquilin (upper panel) and for actin (lower panel). Note successful overexpression of ubiquilin in animals carrying the ubiquilin-1 transgene. (B) Immunoblot analysis similar to A, but this time showing ubiquilin levels in different regions of the brain (Ce = cerebellum, BS = Brain stem, FC = frontal cortex, St = striatum, Hi = hippocampus, VC = visual cortex). Note overexpression of ubiquilin in all tissues of transgenic mice carrying the ubiquilin-1 transgene. (C) Immunoblots of equal amounts of protein in lysates made from the striatum (St), hippocampus (Hi) and frontal cortex (FC) of 9 week-old mice from the same cross mentioned above (W = non-transgenic for UBQ1 or R6/6, U = UBQ1 transgenic, R = R6/2 transgenic, R/U = R6/2-UBQ1 double transgenic) and probed for ubiquilin or actin. (D) Immunoblots of brain lysates from end-stage mice showing R6/2-UBQ1 double transgenic mice have higher ubiquilin levels detected in the resolving gel than R6/2 animals, which correlated with decreased ubiquilin that was trapped in aggregates in the stacking gel. Also included is a lysate from a 19-week old WT animal (right lane). (E and F) Quantification of ubiquilin levels in 9-week (E) and end-stage or equivalent time-point animals (F) showing the amount of ubiquilin protein expression in animals with different genotypes used in our study. Note that ubiquilin levels are reduced by 70% in end-stage R6/2 animals compared to wild type age-matched controls (p = 0.0011). Furthermore, ubiquilin levels were fully restored in the brains of end-stage R6/2-UBQ1 double transgenic mice compared to R6/2 transgenic mice (p = 0.0017). (G) Immunoblot of same lysates shown in D with EM48 antibody showing ubiquilin overexpression in R6/2-UBQ1 double transgenic mice have reduced levels of soluble mutant htt protein accumulation compared to R6/2 animals. Note the WT lysate was loaded on the left lane. (H) Quantification of soluble htt protein shown in panel G.

