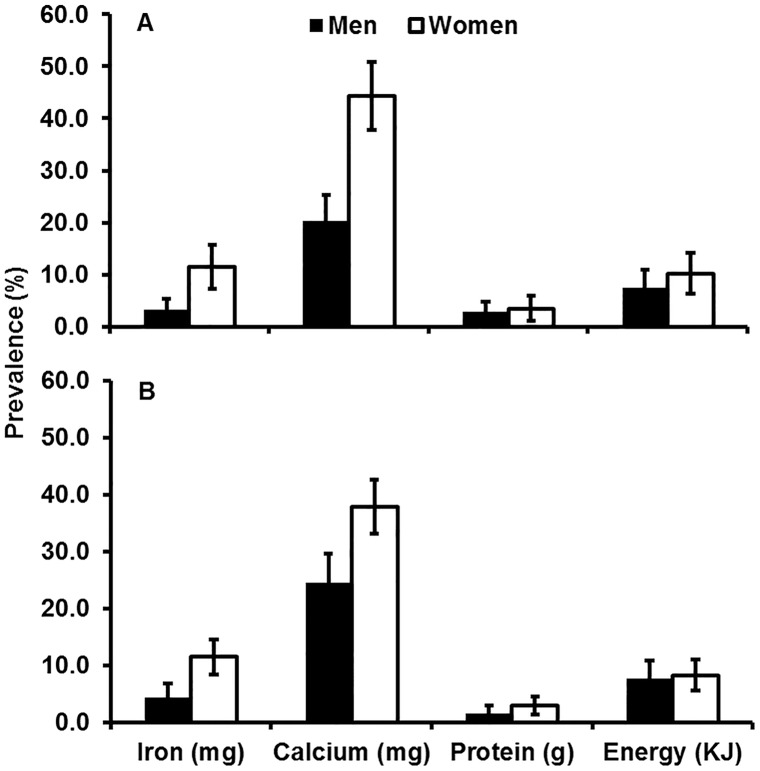
Figure 2. Prevalence of daily nutrient and energy intake deficiencies in men and women aged 18 years and over.
Panel 2A shows data for ‘not low’ income families (>1,000 rupees per month) while panel 2B shows data for low income families (≤1,000 rupees per month). (n = 524 men and 635 women). Error bars show 95% Confidence Intervals. Black bars show data for men and white bars show data for women.

