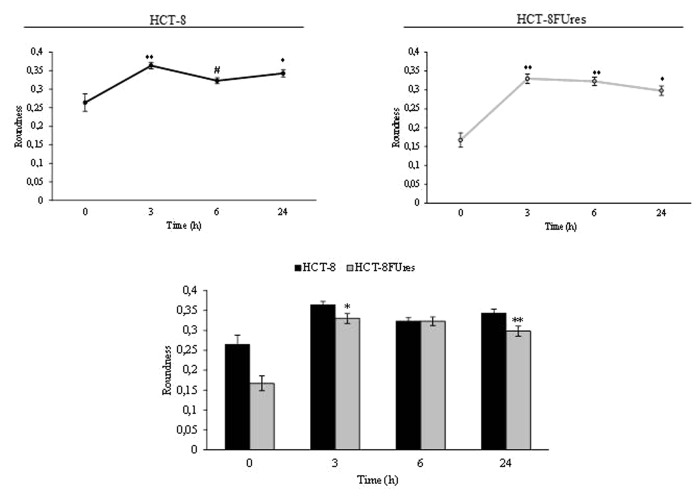
Figure 5. Roundness parameter. Line graphs show roundness mean value ± SE at each time point in HCT-8 and HCT-8FUres cells. *P < 0.05, **P < 0.01 vs. 0 h; #P < 0.05 vs. 3 h by ANOVA followed by Bonferroni post-test. Histogram shows roundness mean value ± S.E., comparing HCT-8 and HCT-8FUres cell lines at each time considered. *P < 0.05; **P < 0.01 by unpaired two-tailed t-test.

An official website of the United States government
Here's how you know
Official websites use .gov
A
.gov website belongs to an official
government organization in the United States.
Secure .gov websites use HTTPS
A lock (
) or https:// means you've safely
connected to the .gov website. Share sensitive
information only on official, secure websites.
