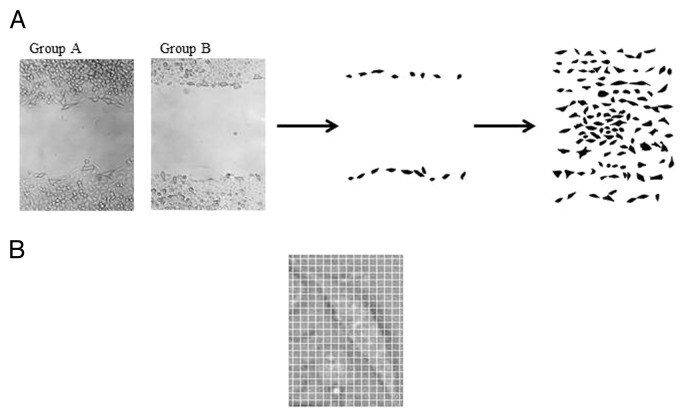
Figure 8. Schematization of the image analysis method. (A) Example of scanned images from group A (A, HCT-8FUres), and group B (B, HCT-8) after 6 h of migration. Single cells were contoured with a fine black marker. The second panel shows a group B (HCT-8) representative image after post-production by Photoshop taken after 6 h of migration. The third panel shows an example of sheet grouping cells analyzed of the same image. (B) Example of zoomed image of a single cell with an overlapped grid. The width of a single square side is 10 pixels, that is 4.96 µm.

An official website of the United States government
Here's how you know
Official websites use .gov
A
.gov website belongs to an official
government organization in the United States.
Secure .gov websites use HTTPS
A lock (
) or https:// means you've safely
connected to the .gov website. Share sensitive
information only on official, secure websites.
