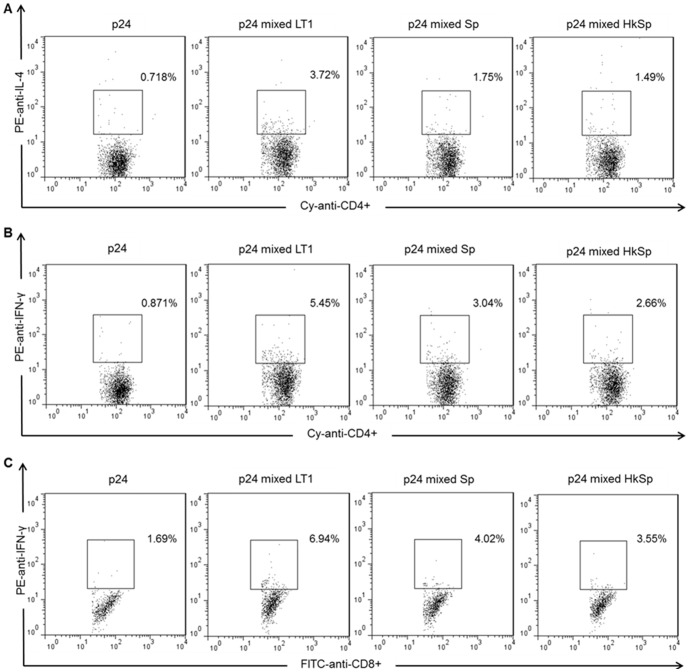
Figure 4. Intracellular cell staining and flow cytometry analysis of p24-specific CD4+ and CD8+ T cells.
BALB/c mice were immunized (three doses on days 0, 14 and 28) with p24 protein (700 ng), p24 (10 µg) admixed with LT1 (1 µg), p24 (700 ng) admixed with spores (2×10⁹) or p24 (700 ng) admixed with heat-killed spores (2×10⁹). Spleen cells were collected two weeks after the last dose, and the detection of IL-4 producing p24-specific CD4+ T cells (A) and IFN-γ producing p24-specific CD4+ (B) and CD8+ T cells (C) was carried out after stimulation with MHC class I or II restricted p24 peptide and cell surface staining for CD8 (FITC), CD4 (Cy) and intracellular staining for IL-4 or IFN-γ (PE). The percentage of each population is indicated in the upper right corners and the frequencies in all groups in the absence of stimulus were below 0.70% (data not shown). Measurements were performed in duplicate for each individual sample, and the data are representative of two independent experiments.

