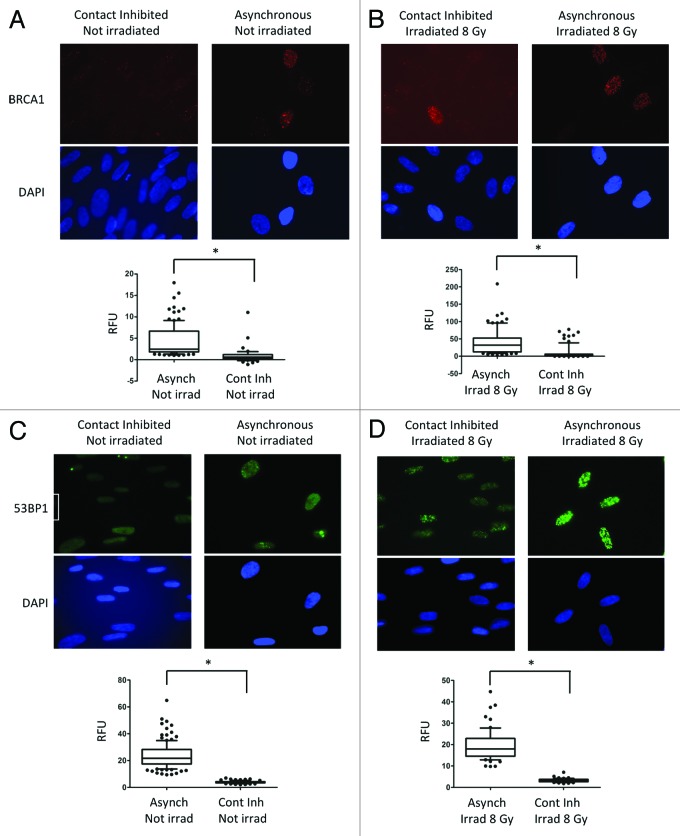
Figure 3. Levels of BRCA1 and 53BP1 and formation of IRIF in growth-arrested and cycling cells. (A) Immunofluorescence with BRCA1 antibody was performed in asynchronous and contact-inhibited cells that were irradiated with 8 Gy or mock irradiated. DAPI staining was used to identify all nuclei. Graph shows quantitation of the intensity of fluorescence (relative fluorescence units) in 200 cells per condition. (B) IF with BRCA1 antibody in cells of the same growth conditions as (A) after irradiation with 8 Gy.Note the decrease in BRCA1 intensity of fluorescence, both in control and irradiated growth-arrested cells. (C) The same experiments as in (A) were performed with 53BP1 antibody. (D) The same experiments as in (B) were performed with 53BP1 antibody.Note how 53BP1 levels mirror BRCA1 in all conditions tested, with low levels of 53BP1 in growth-arrested cells irradiated and control. *Represents P value of statistical significance (P ≤ 0.05).

An official website of the United States government
Here's how you know
Official websites use .gov
A
.gov website belongs to an official
government organization in the United States.
Secure .gov websites use HTTPS
A lock (
) or https:// means you've safely
connected to the .gov website. Share sensitive
information only on official, secure websites.
