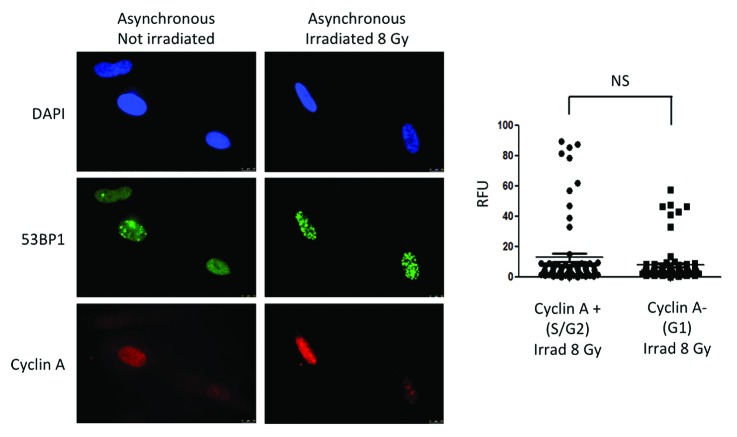
Figure 4. Levels of 53BP1 and formation of IRIF in cycling cells. Immunofluorescence with 53BP1 and Cyclin A antibodies was performed in asynchronously growing cells that were irradiated with 8 Gy or mock irradiated. DAPI staining was used to identify all nuclei. Cyclin A positive cells represent cells in S/G2 phases of the cell cycle, while Cyclin A-negative cells represent cells in G1. Graphs show quantitation of the intensity of fluorescence (relative fluorescence units) in 200 cells per condition. We compared intensity of fluorescence of 53BP1 between Cyclin A-positive (S/G2) and Cyclin A-negative (G1) cells that were irradiated with 8 Gy. Statistically significant differences were not observed (NS).

An official website of the United States government
Here's how you know
Official websites use .gov
A
.gov website belongs to an official
government organization in the United States.
Secure .gov websites use HTTPS
A lock (
) or https:// means you've safely
connected to the .gov website. Share sensitive
information only on official, secure websites.
