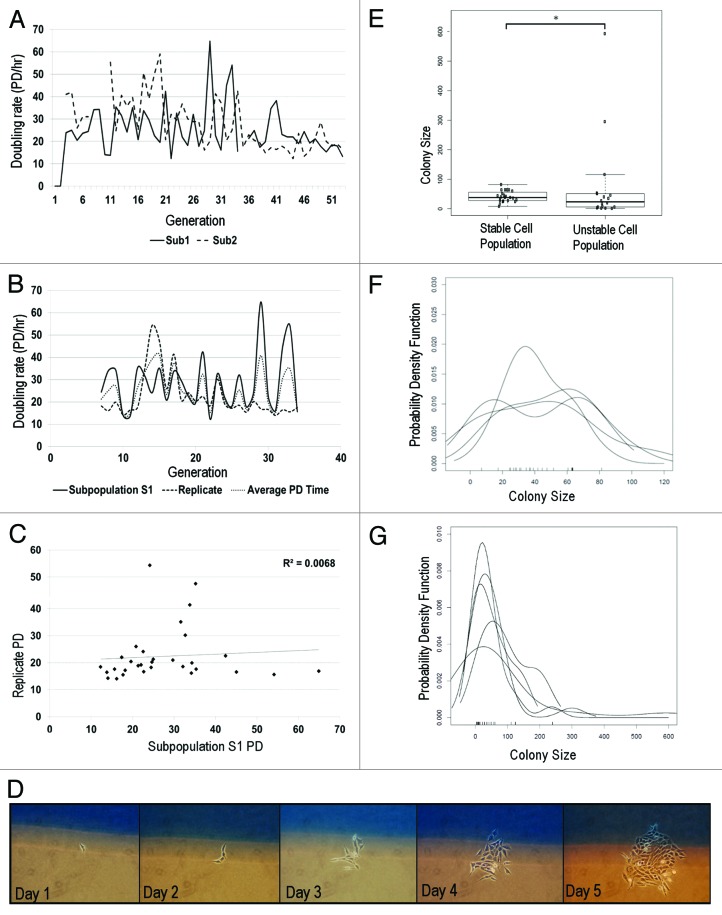
Figure 3: Genome-mediated growth heterogeneity. (A) Population doubling rates of 2 subpopulations isolated from same parent. Each subpopulation exhibits unique growth rate. Variation in PD rates is moderate, as measured by CV (subpopulation 1, 40%; subpopulation 2, 42%) (B) PD rate comparison of 2 independent runs of same subpopulation. Each trial exhibits moderate variation in growth, despite being biological replicates. (Set 1 CV = 44%; Set 2 CV = 45%, n = 2) (C) Regression analysis comparing doubling times of 2 replicates of same subpopulation show no correlation (r2 = 0.0068) (D) In situ single cell growth. Single cells are identified on day 1 and monitored daily. (E) Growth is compared between HCT116 (n = 23) and unstable cells (n = 18). Unstable cells (CV = 200%) display significantly greater growth variation than karyotypically homogeneous HCT 116 cells (CV = 44%). (F-test, P ≤ 1.4 × 10⁻⁶) (F and G): Density growth distributions of stable (F) and unstable (G) cell population replicates. Growth distribution of stable cells are unimodal with a narrow distribution, while unstable cells are bimodal and exhibit extremely broad growth distributions.

An official website of the United States government
Here's how you know
Official websites use .gov
A
.gov website belongs to an official
government organization in the United States.
Secure .gov websites use HTTPS
A lock (
) or https:// means you've safely
connected to the .gov website. Share sensitive
information only on official, secure websites.
