
Figure 1. Retinoic acid induces differentiation of NT2-D1 embryonal carcinoma cells.
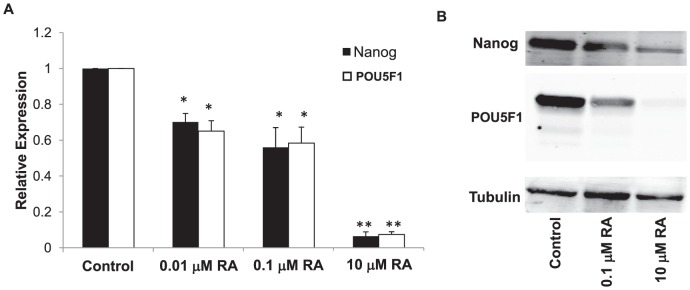
Cells were exposed to RA for 4 days prior to examination of NANOG and POU5F1 levels. A) qRT-PCR analysis; B) western blot analysis. qRT-PCR data was normalized to GAPDH. Each bar in the histogram represents the mean of 3 independent experiments; vertical bars, ±SEM. * p<.05, ** p<0.001.