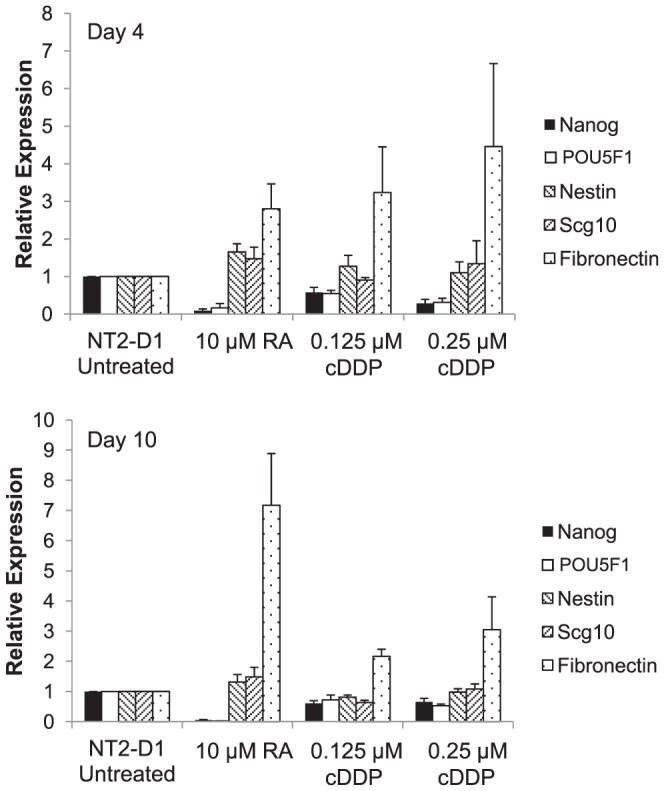
Figure 4. The effect of RA and cDDP on the expression of markers of differentiation in NT2-D1 cells.

NT2-D1 cells were exposed to RA for 4 days or cDDP for 2 days. RNA was collected was collected before and at 4 and 10 days after initiation of RA or cDDP treatment and the levels NANOG, POU5F1, nestin, Scg10 and fibronectin mRNA were determined by qRT-PCR. Each bar presents the results of measurements made in 4 independent experiments performed using triplicate cultures. Vertical bars, ±SEM.
