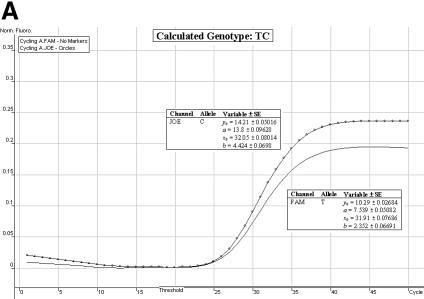
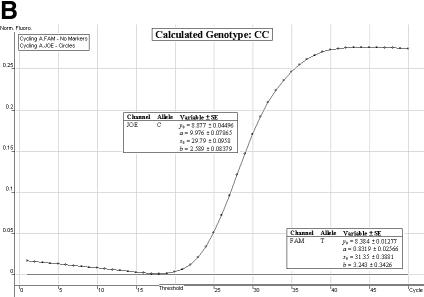
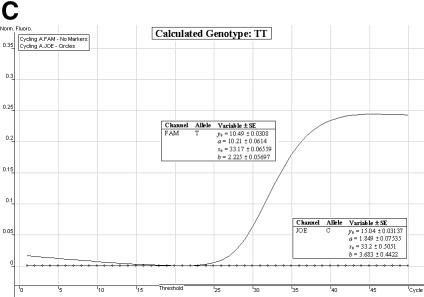
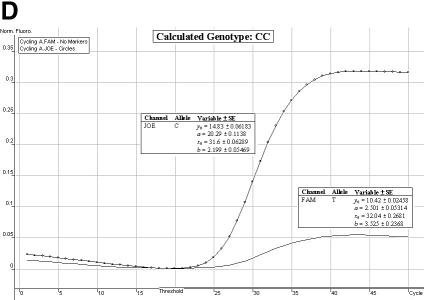
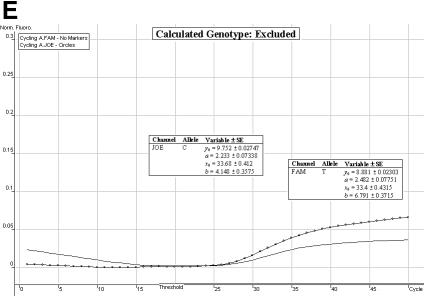
Figure 3.
Allelic discrimination curves produced by the Rotor-Gene 3000™ analysis software. The x-axis represents the amplification cycle number and on the y-axis is the raw fluorescent value (Rx). (A) Example of a true heterozygote (TC) with the amplification curves for both fluorophore channels (JOE, FAM) satisfying the three proposed criteria. (B) Example of a true homozygote (CC) with the amplification curve of the JOE channel satisfying Criteria A and B. (C) Example of a true homozygote (TT) with the amplification of the other channel (FAM) satisfying Criteria A and B. (D) Example of an ambiguous heterozygote. Criteria A and B (allowing a 5% error) were not satisfied for the FAM fluorophore channel, and Criterion C was not met. Hence, a true homozygote (CC) is deduced. (E) Example of another (observational) ambiguous heterozygote. All three genotype criteria were not satisfied for both fluorophore channels (allowing a 5% error). Hence, this sample is excluded from genotypic and allelic association analyses.

