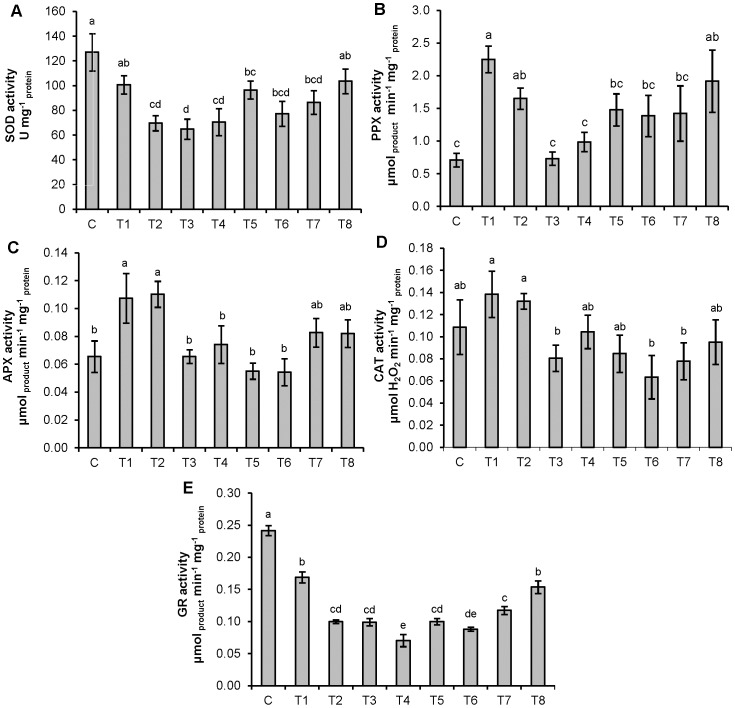
Figure 1. Activities of antioxidative enzymes in tobacco seedlings.
(A) SOD, (B) PPX, (C) APX, (D) CAT and (E) GR. Treatments: C – control, T1 – 10 µM Cd, T2 – 15 µM Cd, T3 – 25 µM Zn, T4 – 50 µM Zn, T5 – 10 µM Cd and 25 µM Zn, T6 –10 µM Cd and 50 µM Zn, T7 – 15 µM Cd and 25 µM Zn, T8 – 15 µM Cd and 50 µM Zn. Vertical bars represent standard errors (n = 6). Columns marked with different letters indicate significantly different treatments (P<0.05) within seedling data set (LSD multiple test).

