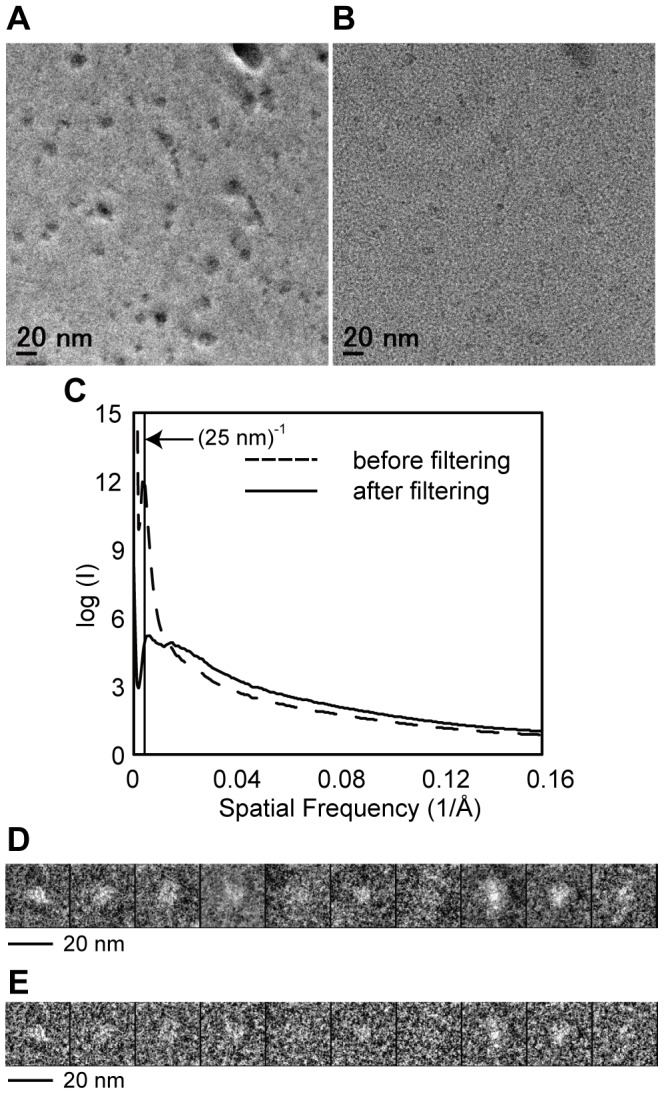
Figure 4. Cryo-EM micrographs of (A) ZPC cryo-EM and (B) defocus phase contrast cryo-EM.

Those two images were taken at the same area under (A) in-focus and (B) 5 µm underfocused conditions. (C) Comparison of the rotationally averaged power spectrum of the ZPC cryo-EM micrograph before and after filtering. The dashed line represents an original ZPC cryo-EM image and the continuous line represents a filtered ZPC cryo-EM image. (D) (E) Examples of particles picked from original ZPC cryo-EM images and filtered ZPC cryo-EM images, respectively. The contrast of each particle stack has been inverted.
