Figure 2.
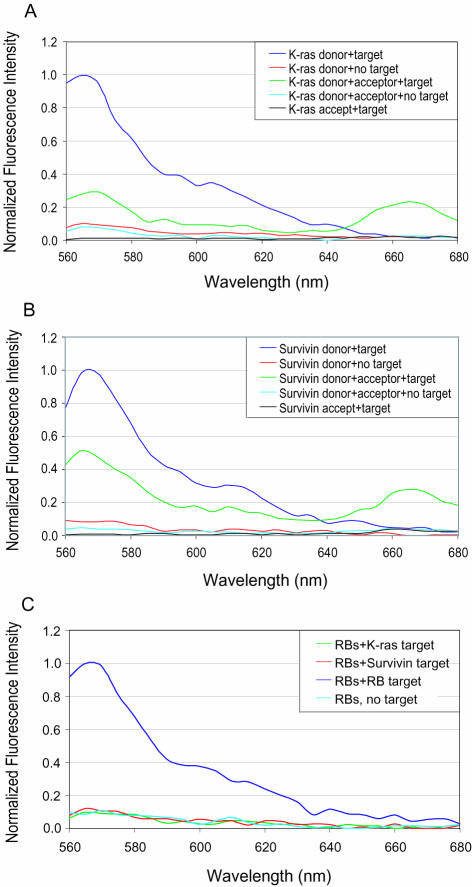
Solution studies of probe–target hybridization of dual FRET molecular beacons. (A) Fluorescence emission spectra of K-ras targeting molecular beacons under Cy3 excitation (545 nm). The blue curve was generated by having donor beacons only in the presence of target, representing the signal of a single beacon assay. The red curve was a result of having donor beacons only without target, representing the background of a single-beacon assay. The green curve was due to both donor and acceptor beacons in solution with target, representing the FRET signal. The light blue curve was due to both donor and acceptor beacons in solution without target, representing the background of a FRET assay. The black curve was a result of having acceptor beacons only in the presence of target, representing the background signal of single acceptor beacons. A high signal-to-background ratio was obtained at the peak FRET signal (∼665 nm). (B) Emission spectra for survivin-targeting molecular beacons, with the four curves defined as in (A). (C) Emission spectra for ‘random sequence’ molecular beacons (RBs) with, respectively, complementary targets (blue curve), survivin targets (red curve), K-ras targets (green curve) and no target (light blue curve), indicating very high hybridization specificity.

