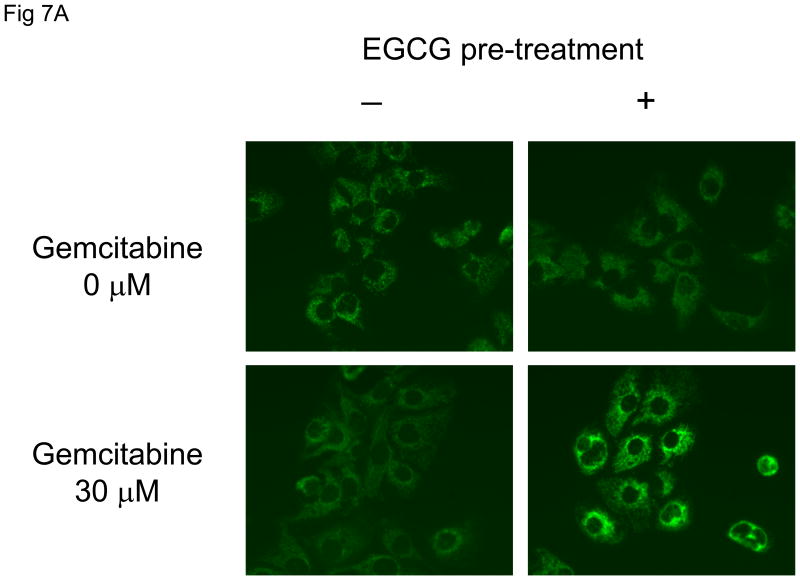
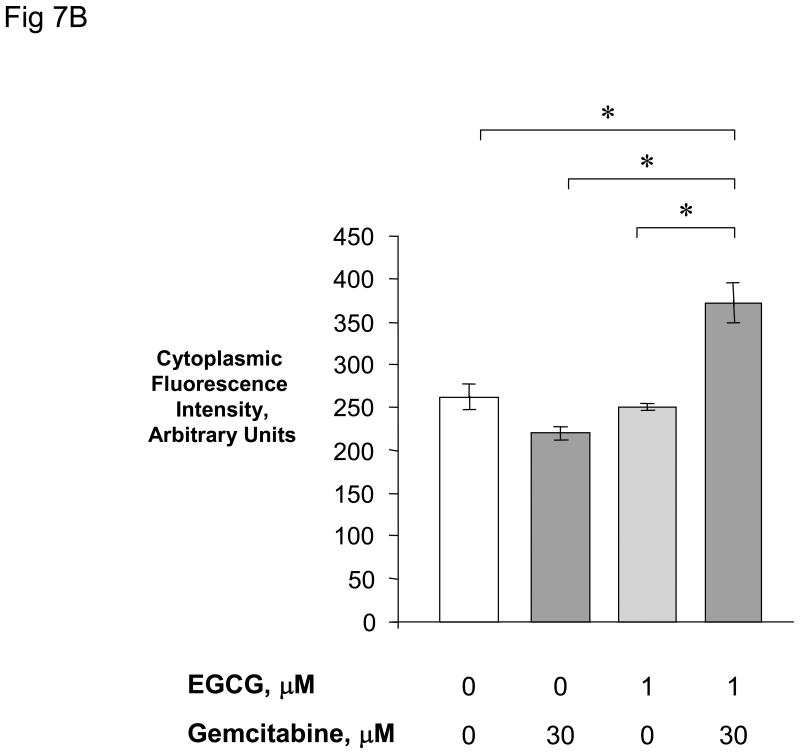
Figure 7. EGCG + gemcitabine increase cytoplasmic cytochrome C release.
Panel A: Mz-ChA-1 cells were pre-incubated for 1 hour with 1 μM EGCG or diluent control prior to treatment with either 0 or 30 μM gemcitabine for 24 hours. Immunocytochemistry was performed for cytochrome C, and images obtained by fluorescence microscopy. Panel B: The fluorescence intensity was measured in cellular cytoplasmic regions in all cells in a randomly selected field using the Metamorph 6.2 image analysis software. The data represents mean ± 95% confidence intervals from 11-13 cells in each group. *p < 0.01.


