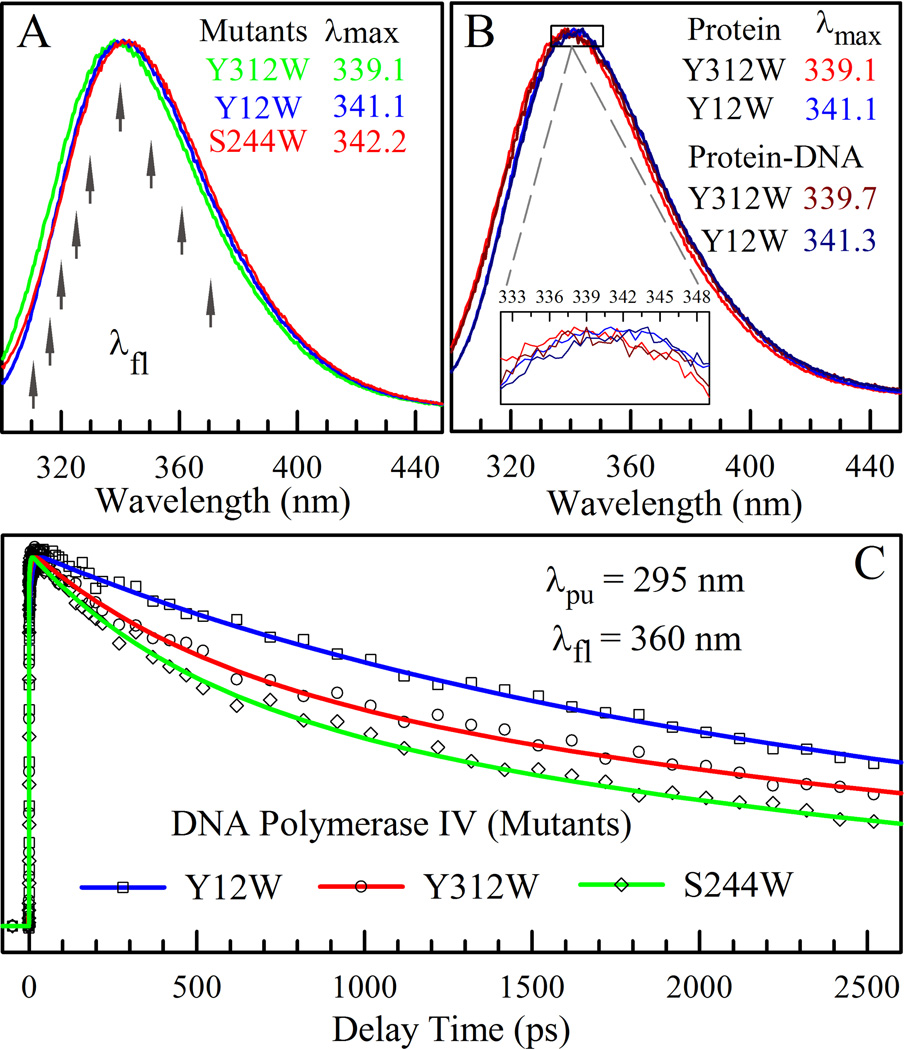
Figure 2.
(A) Normalized steady-state emission spectra of three Dpo4 mutants in the apo state. The arrows indicate the fluorescence wavelengths gated in fs-resolved measurements. (B) Normalized steady-state emission spectra of the mutant Y12W at the active site in the finger domain and Y312W as a control in the little finger domain with and without binding to DNA. The inset shows a close-up view around the emission peaks and the peak differences are minor. (C) Femtosecond-resolved fluorescence transients of the three Dpo4 mutants gated at 360 nm in apo state. The symbols are the experimental data and the solid lines are the best exponential fit.

