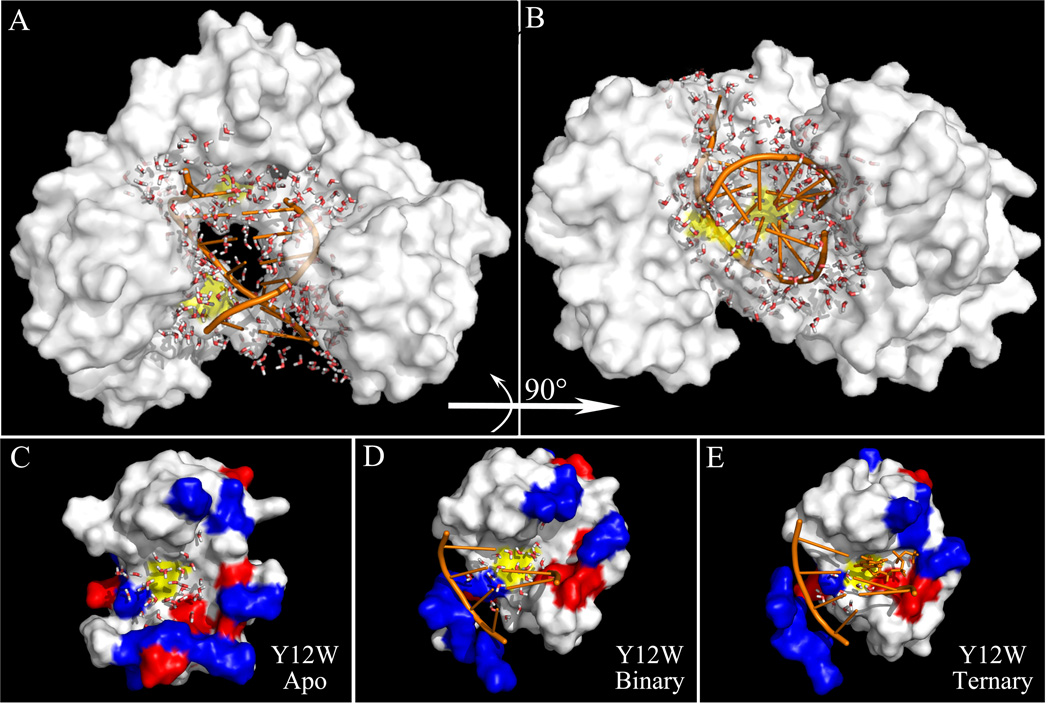
Figure 7.
A snapshot from a molecular dynamics simulation in 4 ns. (A) and (B) show 274 interfacial water molecules between Dpo4 (white) and DNA (orange) from two different views. The mutation sites are shown by the yellow patches. (C), (D) and (E) show the local structures of Y12W within 12 Å and interfacial water molecules within 7.5 Å from the probe tryptophan in the three states. The positive and negative charged residues are in blue and red and the neutral residues in white. The mutation site is patched in yellow. The dsDNA is shown in orange while the nucleotide dCTP in orange sticks (E). Within 7.5 Å, 30, 21 and 10 water molecules were observed in the apo, binary and ternary states, respectively.

