Figure 3.
Analysis of Gene Expression in Tannat Berries.
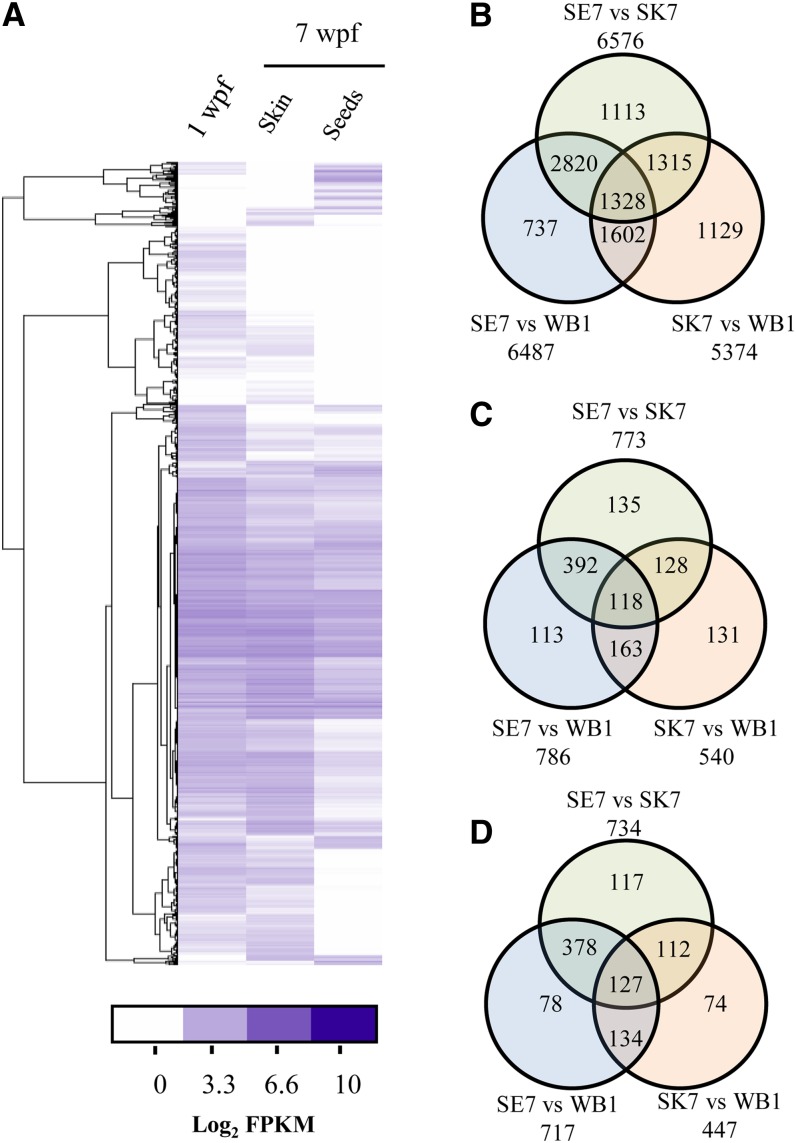
(A) Hierarchical clustering of RNA-Seq read counts (Log2 FPKM) in three tissues of Tannat berries.
(B) Venn diagram showing numbers of commonly and uniquely differentially expressed known genes in pairwise comparisons of whole berry at 1 wpf (WB1), seeds at 7 wpf (SE7), and skin at 7 wpf (SK7).
(C) Venn diagram showing numbers of commonly and uniquely differentially expressed novel genes in pairwise comparisons among WB1, SE7, and SK7 samples.
(D) Venn diagram showing numbers of commonly and uniquely differentially expressed varietal genes in pairwise comparisons among WB1, SE7, and SK7 samples.

