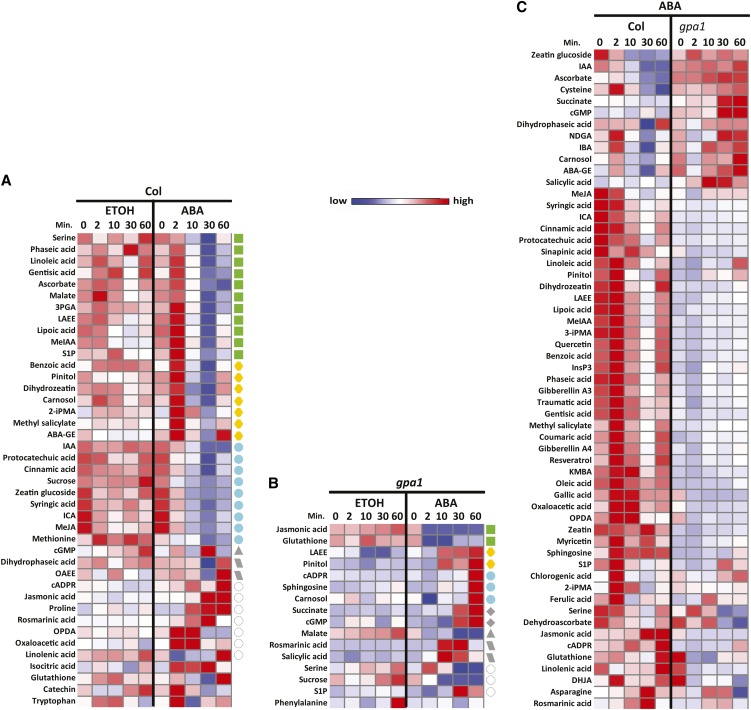
Figure 5.
Heatmaps of Normalized Abundance of the Metabolites Show Differential Responsiveness of Col and gpa1 Guard Cell Metabolomes to ABA.
(A) The metabolites in Col that show statistically significant temporal differences in abundance between ethanol and ABA treatments (EDGE, P < 0.05 and Q < 0.05 in all cases). The green, yellow, aqua, gray, and white symbols correspond to the modules of Figure 3.
(B) The metabolites in gpa1 that show statistically significant temporal differences in abundance between ethanol and ABA treatments (EDGE, P < 0.05 and Q < 0.05 in all cases). The green, yellow, aqua, gray, and white symbols correspond to the modules of Figure 4.
(C) The metabolites that show statistically significant temporal differences in abundance between Col and gpa1 over a time course of ABA treatment (EDGE, P < 0.05 and Q < 0.05 in all cases).
2-iPMA, 2-isopropylmalic acid; 3-iPMA, 3-isopropylmalic acid; 3PGA, 3-phosphoglyceric acid; ABA-GE, abscisic acid Glc ester; DHJA, dihydrojasmonic acid; IBA, indole butyric acid; KMBA, methylthiobutyric acid; MeIAA, methyl indole acetate; NDGA, nordihydro guaiaretic acid; OAEE, oleic acid ethylester; OPDA, 12-oxophytodienoic acid.

