Figure 2.
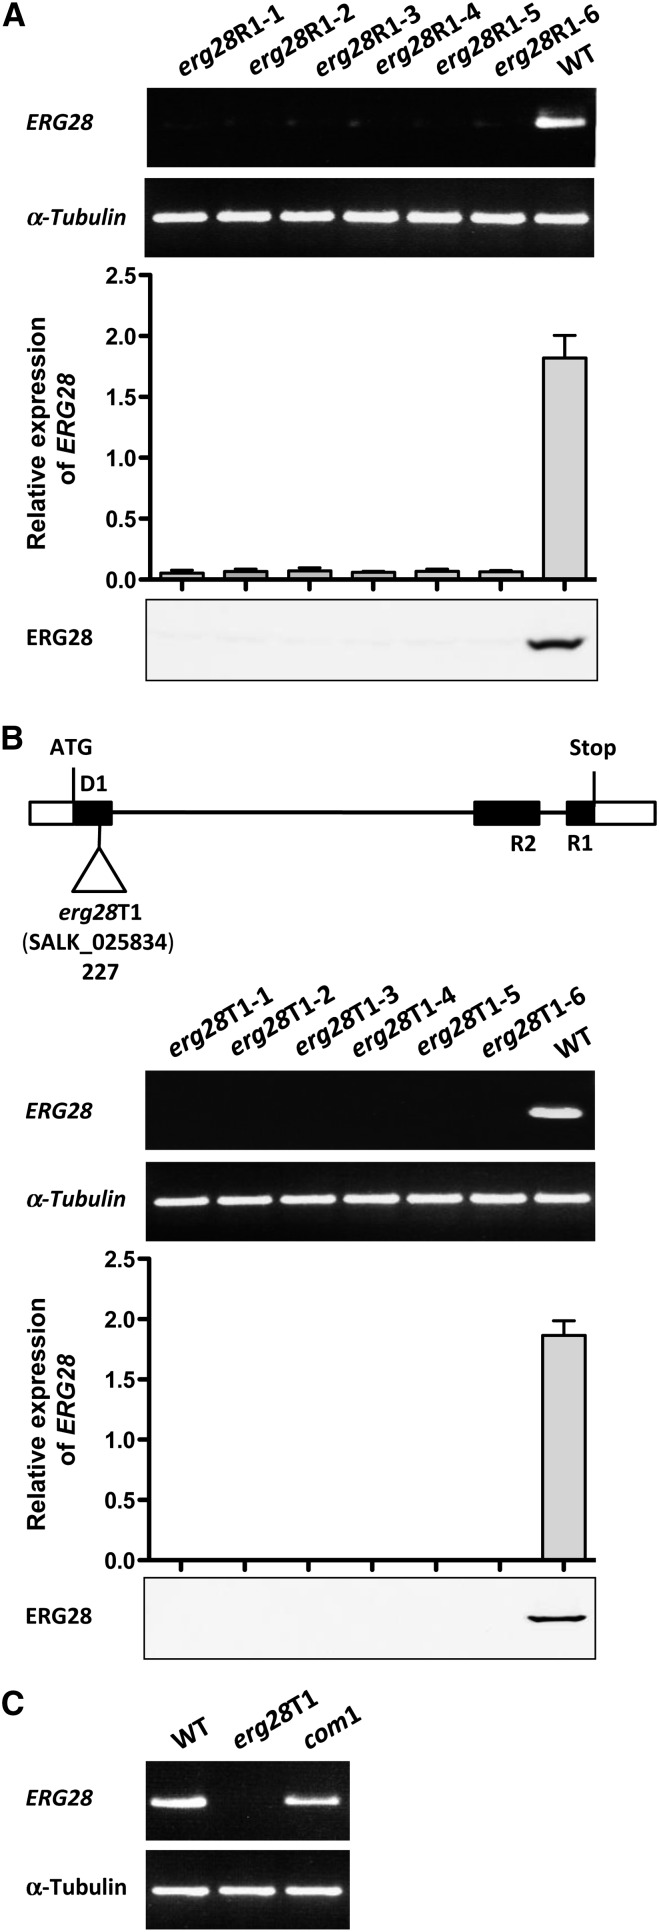
Characterization of Arabidopsis erg28RNAi (erg28R1-1 to erg28R1-6) and erg28T-DNA (erg28T1-1 to erg28T1-6) Mutants.
(A) erg28RNAi plants were named erg28R1-1 to erg28R1-6. RT-PCR (top) and qRT-PCR analyses (middle) of ERG28 transcript of erg28R1-1 to erg28R1-6 and wild-type (WT) plants, followed by immunoblot analysis (bottom) using anti-Arabidopsis ERG28. α-Tubulin (At1g04820) was used as a positive control for the RT-PCR (27 cycles for α-Tubulin and 35 cycles for erg28R1-1 to erg28R1-6 plants). The results of the qRT-PCR analysis represent mean values (error bars are sd; n = 3).
(B) erg28 T-DNA plants derived from the SALK line (SALK_025834) bearing an insertion in ERG28 (At1g10030) were designated erg28T1-1 to erg28T1-6 and characterized. Schematic diagram (top) shows the T-DNA insertion indicated by the open triangle (black boxes, thin lines, and white boxes indicate exons, introns, and untranslated regions, respectively; D1, R1, and R2 were used as primers), followed by RT-PCR (top middle), qRT-PCR (bottom middle), and immunoblot (bottom) analyses performed as in (A) compared with wild-type plants. The results of the qRT-PCR analysis represent mean values (error bars are sd; n = 3). The combinations of D1-R1 and D1-R2 give the same result.
(C) RT-PCR characterization of erg28T-DNA knockout plants complemented with Arabidopsis ERG28 (com1) compared with wild-type plants. Experimental conditions were as shown in (A).

