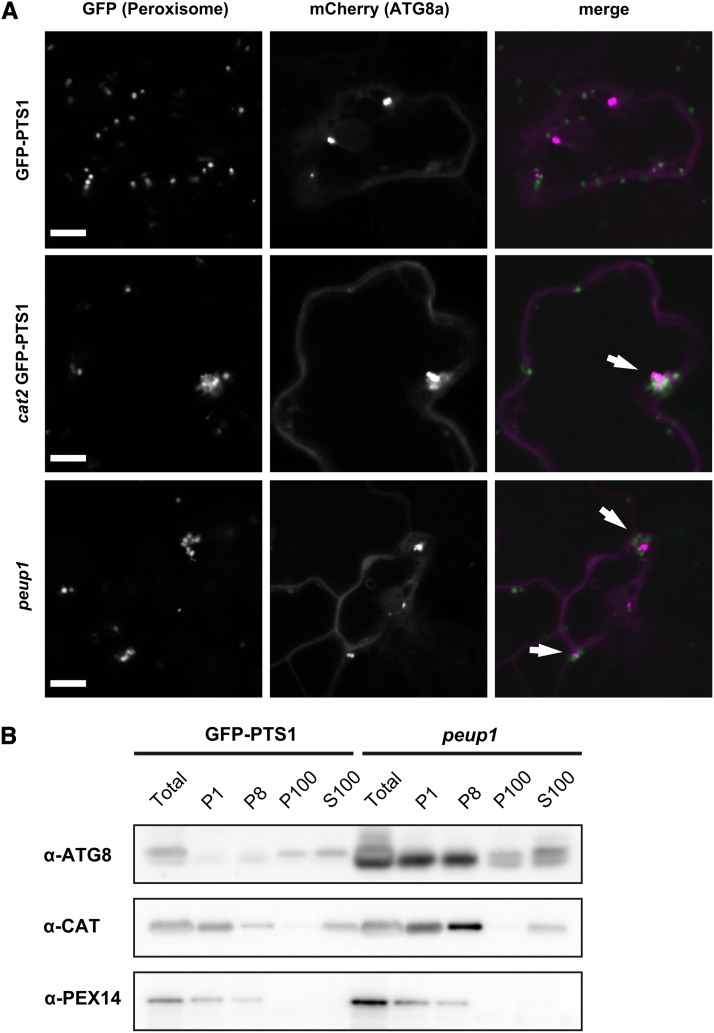
Figure 8.
Subcellular Localization of Autophagosome Marker ATG8.
(A) Confocal images of leaf cells of a GFP-PTS1 plant, cat2-1 GFP-PTS1 mutant, and peup1-1 mutant transiently expressing mCherry-ATG8a. Arrows indicate peroxisomes colocalizing with punctuate structures of ATG8. Bar = 10 μm.
(B) Immunoblot analysis by differential centrifugation. Total proteins (Total) prepared from the leaves of 3-week-old plants were fractionated into P1, P8, P100, and S100 fractions. The samples were subjected to SDS-PAGE followed by immunoblot analysis using α-ATG8, α-CAT, and α-PEX14 antibodies. ATG8 is an autophagosome marker, and PEX14 and CAT are peroxisome markers.

