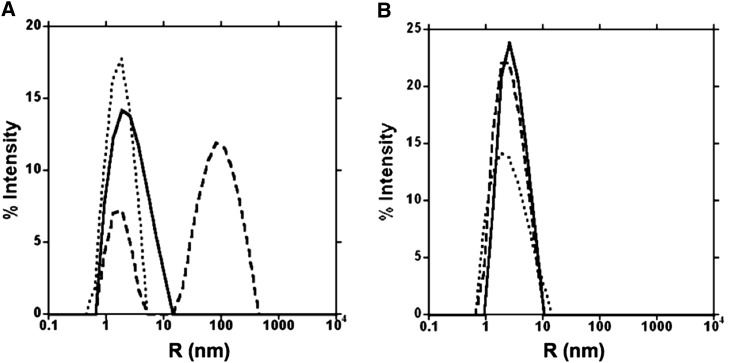
Figure 1.
DLS Patterns for PMC-6 and PMC-567.
(A) Hydrodynamic radius profile of PMC-6 in the presence or absence of papain in pH 7.2 PBS.
(B) Hydrodynamic radius profile of PMC-567 in the presence or absence of papain in pH 7.2 PBS. The y axis represents the percentage of the scattered light, and the x axis (log scale) represents the radius of the PMC molecules, acetylated papain molecules, or PMC/papain complexes. The dotted line represents PMC-6 or PMC-567 alone, the dashed line represents PMC-6 or PMC-567 with acetylated papain, and the solid line represents acetylated papain alone.

