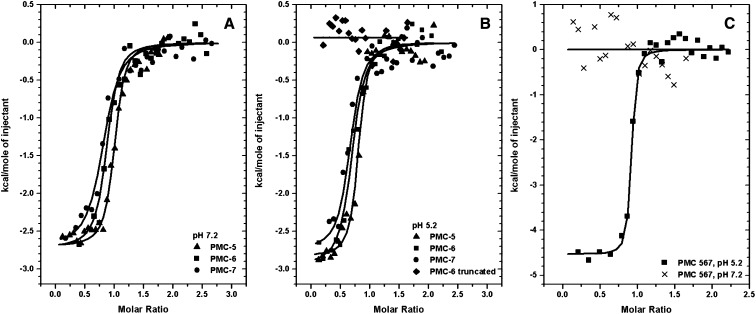
Figure 3.
Measurement of Papain Binding by ITC.
The trend of heat released by serial injections of papain into PMC-5, -6, and -7 at pH 7.2 (A), PMC-5, -6, and -7 and truncated PMC-6 at pH 5.2 (B), and PMC-567 pH 5.2 and PMC-567 pH 7.2 (C) was monitored. Solid lines represent the least square fits of the data.

