Figure 9.
Native Crystalline PMC.
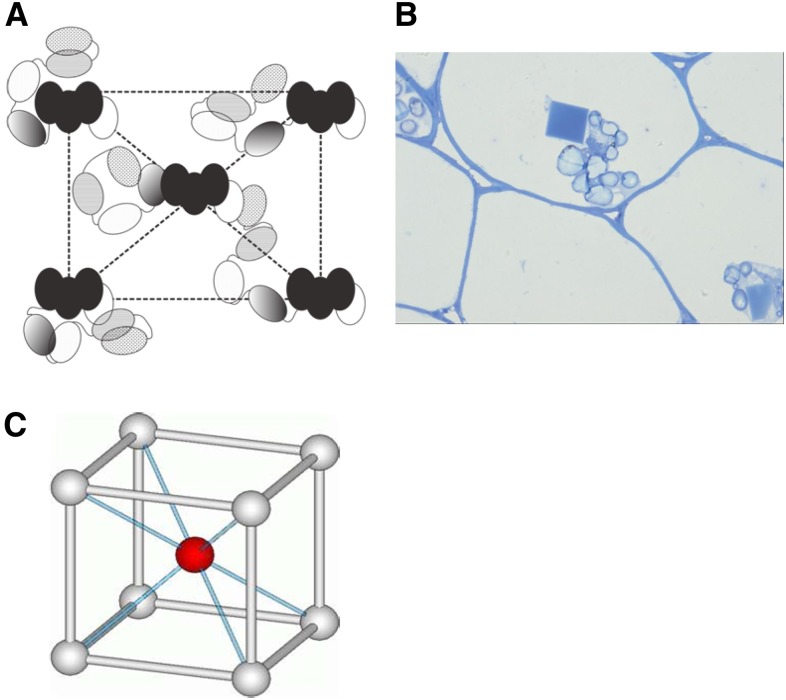
(A) A schematic representation of the plausible arrangement of PMC molecules in a native PMC lattice. Domains are represented as ellipses, and black ellipses represent the core domain, PMC-567.
(B) Light microscope picture of the in vivo crystalline PMC, possessing the unit cell dimensions of a = 205 Å, b = 208 Å, c = 236 Å, and α = β = γ = 90° (Nissen et al., 2009).
(C) Representation of an I-centered crystal lattice, which is the lattice structure of native crystalline PMC.
[See online article for color version of this figure.]

