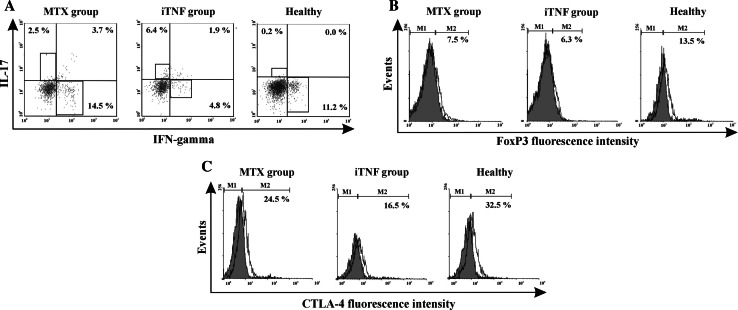
Fig. 1.
Representative examples of flow cytometric analyses of Th1, Th17, Treg, and functional CTLA-4+ Treg cell populations in active RA patients and controls. a Th1 (CD4+IL-17-IFN-γ+) and Th17 (CD4+IFN-γ-IL-17+) cells in studied groups presented as dot plots. b Expression of FoxP3 transcription factor in total CD4+ T cells in the studied groups presented as open histograms. c Expression of CTLA-4 suppressive molecule in total CD4+FoxP3+ T cells in the studied groups presented as open histograms. Grey histograms represent isotype controls

