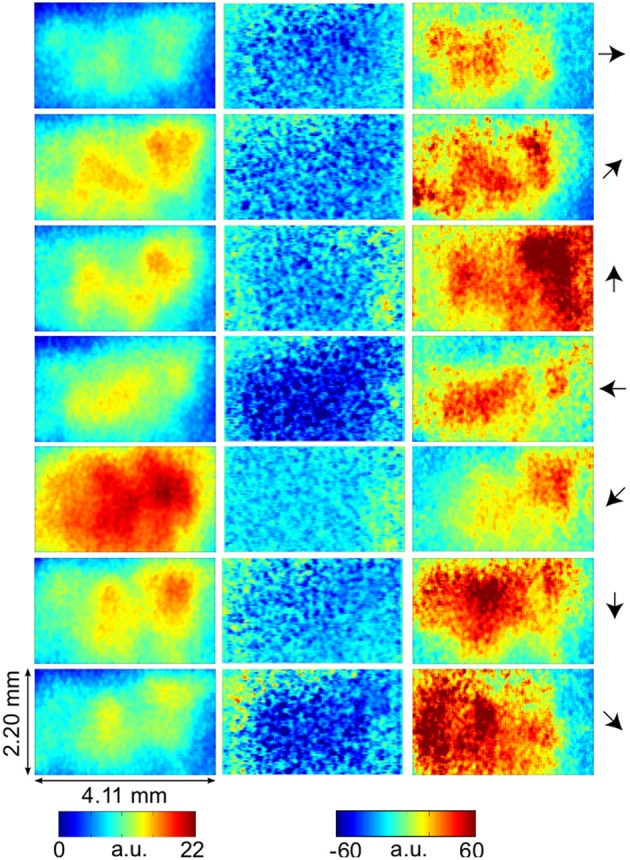
Figure 2.

VSD-activity and local active information storage (LAIS) maps. VSD activity averaged over stimulation epochs and time after stimulus onset after the initial transient (0.2–1 s) (left column). LAIS map immediately after stimulus onset—negative values (blue) indicate surprise of the system (middle column). Time-average LAIS maps from the stimulus period after the initial transient (0.2–1 s) (right column). Rows 1–7 present different stimulus motion directions: 0, 45, 90, 180, 225, 270, 315 (in degrees, indicated by arrows on the right, arrow colors match time-trace colors in Figure 3). 67 × 137 data pixel per image, pixel dimension 30 × 32 μm2. Left–right image direction is anterior–posterior direction.
