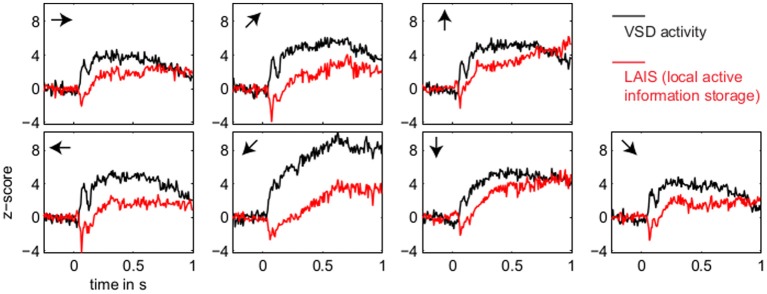
Figure 3.

Temporal evolution of VSD activity and local active information storage. Spatial averages over the 67 × 137 data pixels for VSD activity (black traces), and the LAIS (red traces) versus time. Motion directions are indicated by arrows for each panel. Note that LAIS for the vertical, the right, and the downward-right motion directions continues to rise toward the end of the stimulus interval, despite declining activity levels. Also note that the unexpected onset response at approximately 40 ms leads to negative active information storage. For an explanation see the Materials and Methods section.
