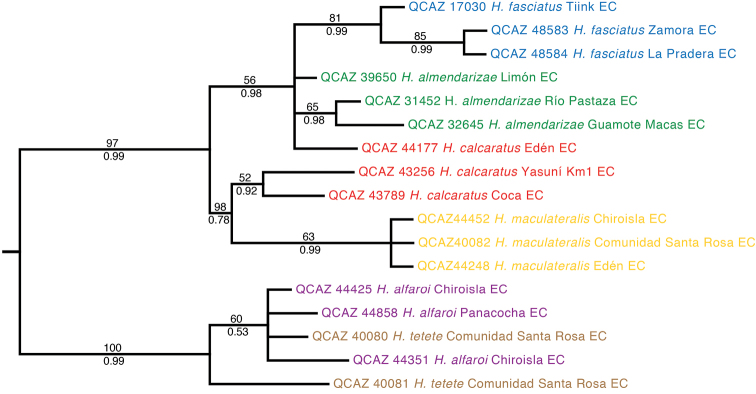
Figure 2.

Maximum likelihood phylogram depicting relationships within Hypsiboas. The phylogram was derived from analysis of 1272 bp of nuclear DNA (gene fragments RAG-1 and POMC). Museum catalog number and locality are shown for each sample. Bootstrap values are shown above the branches and Bayesian posterior probabilities are shown below; values below 50 (bootstrap) or 0.5 (posterior probability) are not shown. Colors refer to clades identified using mtDNA (see Figure 1).
