Figure 2.

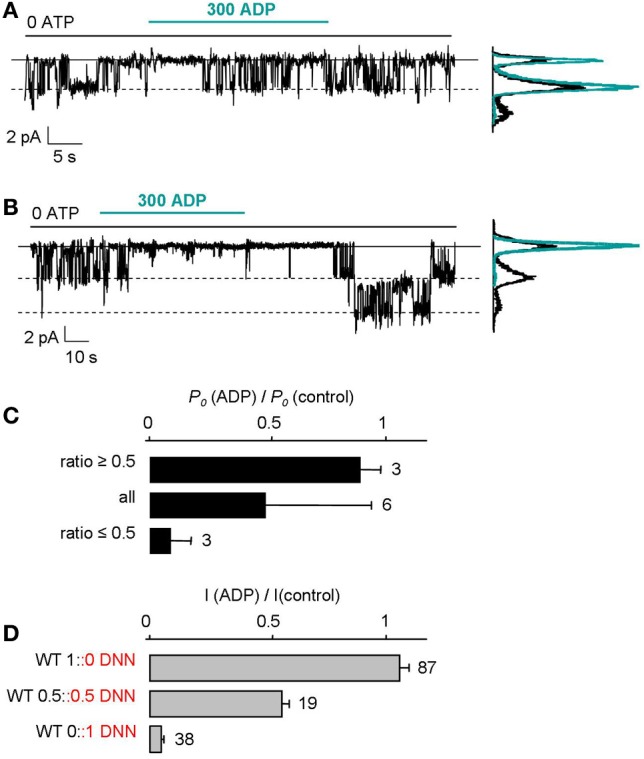
All-or-none responses of single KATP channels to MgADP. (A,B) Recordings of single KATP channels in inside-out patches excised from oocytes injected with 0.02 ng of Kir6.2 RNA and 0.03 ng each of WT and mutant SUR2A RNAs. Compared to macroscopic current experiments, the amount of RNA injected was reduced 100-fold and smaller patch pipettes were used to lower the channel density toward 1 per patch. Amplitude histograms computed from the current records before (black) and ~10 s after (green) ADP application. (C) Using records as in (A) and (B), the ratios of the open probabilities (Po) measured after and before ADP application were calculated from amplitude histograms and revealed 2 clusters near 1 (as in A where ratio was 0.86) and near 0 (as in B where ratio was 0.03). The histogram plots average values of the ratio using either all values, or values above 0.5, or values below 0.5. (D) Mean effect of 300 μM ADP on macroscopic currents from WT, mutant, and an equal mix of WT and mutant channels. Numbers beside bars indicate the number of patches included in the averages.
