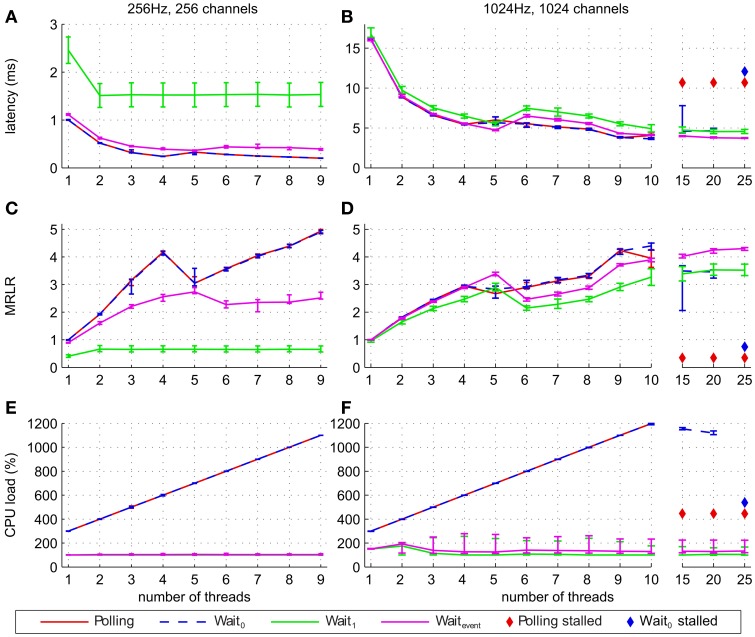
Figure 4.
Performance of the filter pipeline implementing the short-time Fourier transform algorithm for different waiting strategies and different number of threads. Lines show median of latencies (A,B), median of relative latency reduction (C,D), and median CPU load (E,F). The latencies, MRLR and CPU load of the waiting strategies Polling and Wait0 are very similar, so that their graphs mostly coincide. Error bars show the 25% and 75% percentiles. Panels on the left (A,C,E) show results for simulations with 256 Hz and 256 channels, while panels on the right (B,D,F) show results for simulations with 1024 Hz and 1024 channels. In addition, panels (B,D,F) (simulations with 1024 Hz and 1024 channels) show median latencies, MRLR and CPU load for 10, 15, 20, and 25 threads. For high number of threads a diamond symbol indicates that at least one out of ten simulations stalled when the corresponding waiting strategy was used.

