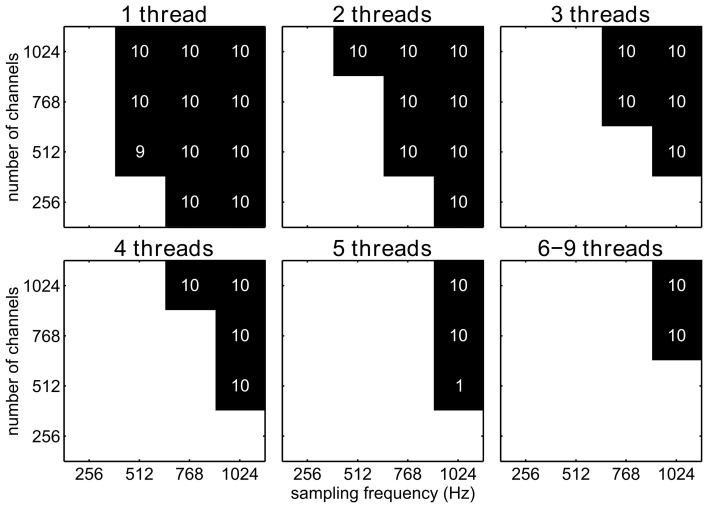
Figure 5.
Stalls for a filter pipeline implementing the Savitzky–Golay algorithm and using the Waitevent waiting strategy, shown for different channel number/sampling frequency combinations and different numbers of threads (1–9). A black square indicates combinations for which at least one out of ten simulations stalled, while white square stands for no stalls. Numbers in black squares indicate how many stalls out of ten simulations occurred.

