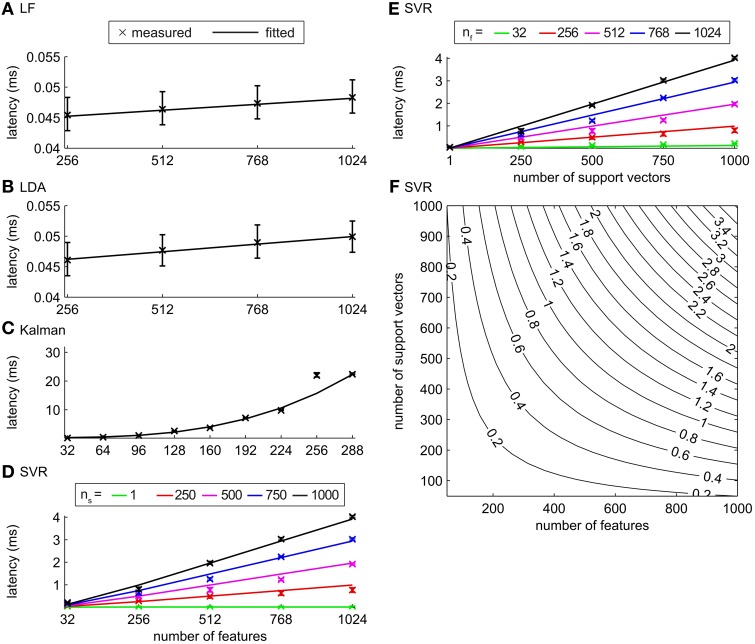
Figure 6.
Latencies for classification/regression algorithms. (A) LF, (B) LDA, (C) KF, and (D–F) SVR. Crosses depict median latencies and error bars show 25% and 75% percentiles. Solid lines show fits of algorithm specific models to the measured values. (D) Latencies for the SVR algorithm as a function of the number of features for ns = 1, 250, 500, 750, and 1000. (E) Latencies for the SVR algorithm as a function of the number of support vectors for nf = 32, 256, 512, 768, and 1024. (F) Latencies given by the model of the SVR algorithm as a function of nf and ns.

