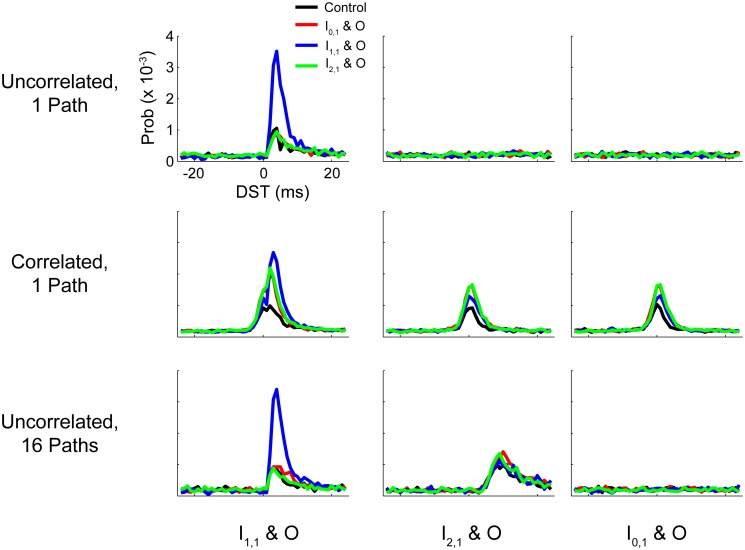
Figure 11.
Summary DST distributions for tested networks. Summary of distributions of DSTs across all tested networks for the three input-output neuron pairs. Each distribution was generated by collapsing DSTs over the first 50 analysis intervals (250 s). Note that the scale of the ordinate axis is linear.

