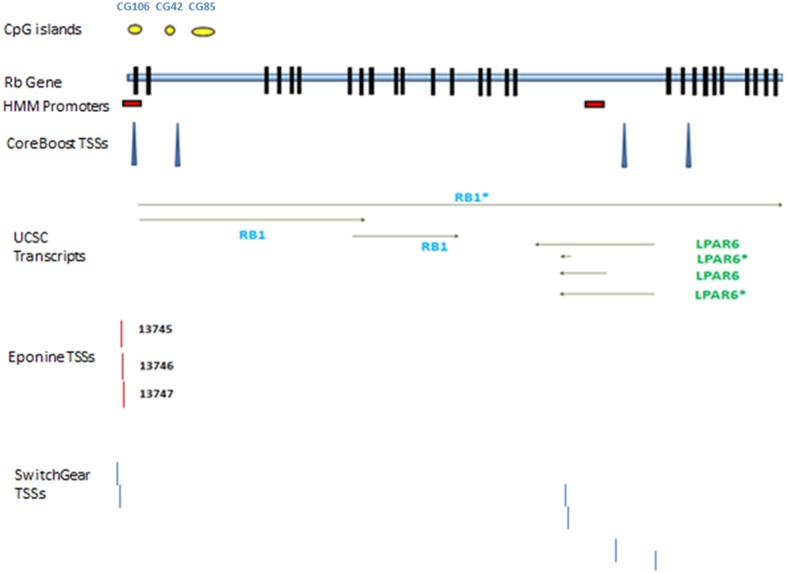
Figure 1.

Rb1 gene structure. Transcribed RNAs from this locus identified by UCSC genome browser. The exons are represented by black blocks. Different promoters and transcription start sites of Rb1 locus are shown. The diagram shows a schematic representation of results from different databases and programs which are described in the text. The yellow circles show CpG islands identified by UCSC genome browser. There are two red boxes which show the promoters identified by HMM-Promoter prediction algorithm. TSSs (Transcription start sites) are recognized by different algorithms such as CoreBoost, Eponine, and SwitchGear. LPAR is a gene within Rb1.
