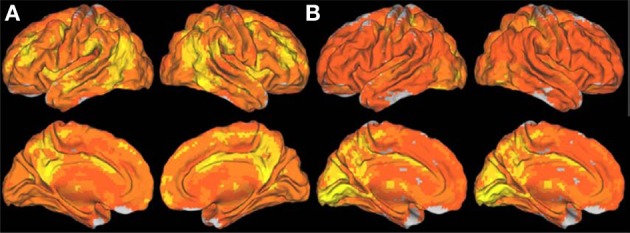
Figure A1.

Surface rendering showing the spatial distribution of the long- (A) and short-range (B) FCD in the human brain, which reflect the average number of functional connections per voxel across 289 participants. The images were created using the Computerized Anatomical Reconstruction and Editing Toolkit (CARET) 5.62, which is a free software developed at Washington University (http://brainvis.wustl.edu/wiki/index.php/Caret:About).
