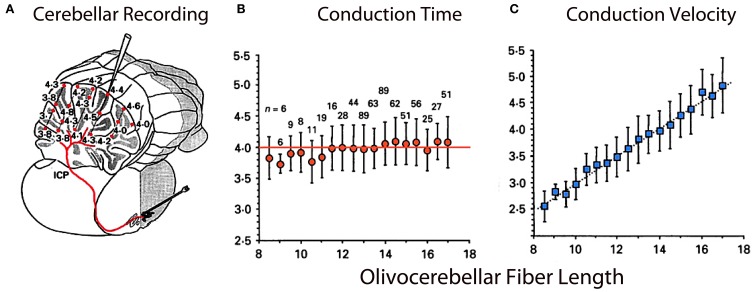
Figure 8.
Olivocerebellar conduction times. (A) Drawing of cerebellum showing conduction times for evoked complex spikes (parasagittal plane 4 mm from midline) in an in vivo preparation. (B) Plot of mean conduction time (±sem) as a function of olivocerebellar fiber length (0.5 mm bins) showing that conduction time was independent of distance between IO and individual Purkinje cell. (C) Plot showing close to linear relationship between mean conduction velocity (±sem) and fiber length. (Modified from Sugihara et al., 1993).

