
Figure 7.
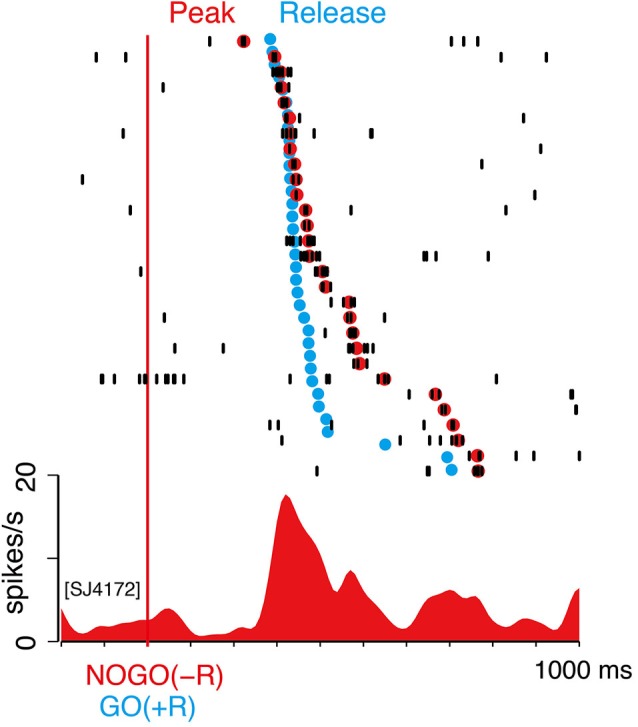
NOGO(−R) activations did not precede GO(+R) action. Example of NOGO(−R) response of the same neuron in Figure 6A; aligned according to NOGO(−R) onset. Raster displays of spikes are shown in order of shorter peak latency from top to bottom. Red dots indicate time of peak activity. The trials in which peak activity was not detected are not shown. Onset time of GO(+R) action in the same block is superimposed on the raster display by blue dots.