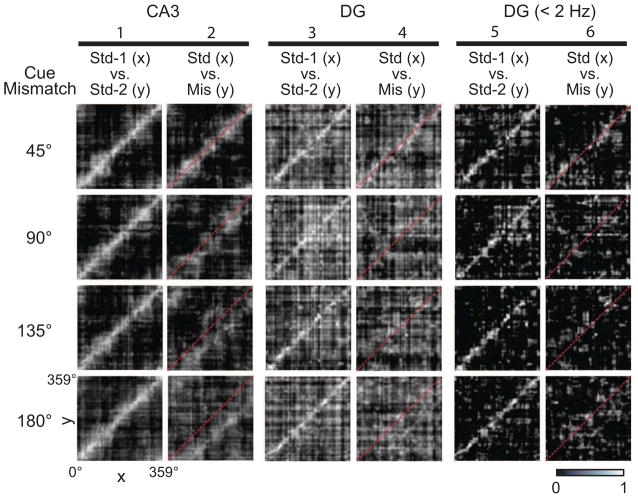
Figure 4.
Population responses to cue-mismatch manipulations. Spatial correlation matrices were produced by correlating the normalized firing rate vectors for a standard session with those of the following mismatch or standard session (Figure S4). CA3 representations maintained coherence in all mismatch sessions (column 2), indicated by the bands of high correlation (white) shifting below the identity line (red dash), despite the decorrelated DG representations found in the input (columns 4 and 6). See also Figures S4, S5, and S6.

