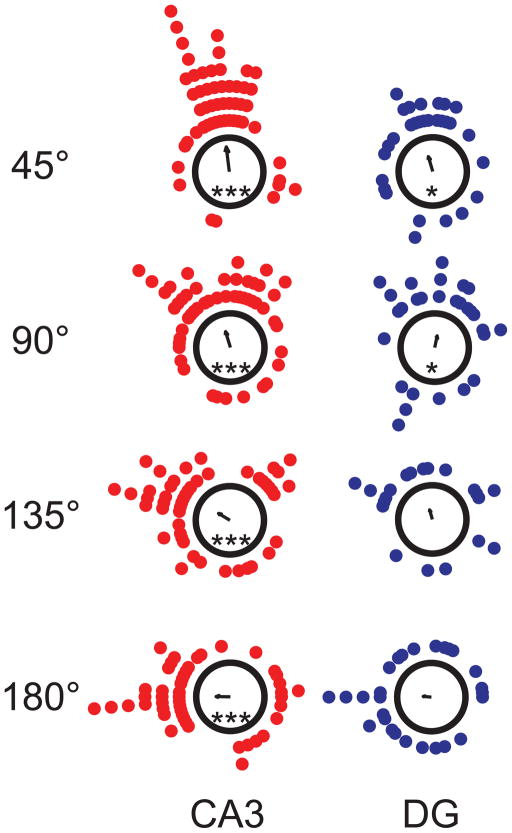
Figure 6.
Analysis of Individual Cell Rotation Amounts. Each dot indicates the amount that the cell’s spatial firing rotated between the standard and mismatch sessions (CA3, red; DG, blue). The arrows at the centers of the polar plots denote the mean vector. The mean vector length for CA3 cells was significant for all mismatch angles, whereas the mean vector length for the DG was variable (Rayleigh test; CA3, all angles, p < 0.001; DG, 45° and 90°, p < 0.04). CA3 followed the local cues for all mismatch angles and DG followed the local cues for 3 out of the 4 mismatch angles (45°, 135°, and 180°). ***, p < 0.001; *, p < 0.04.

