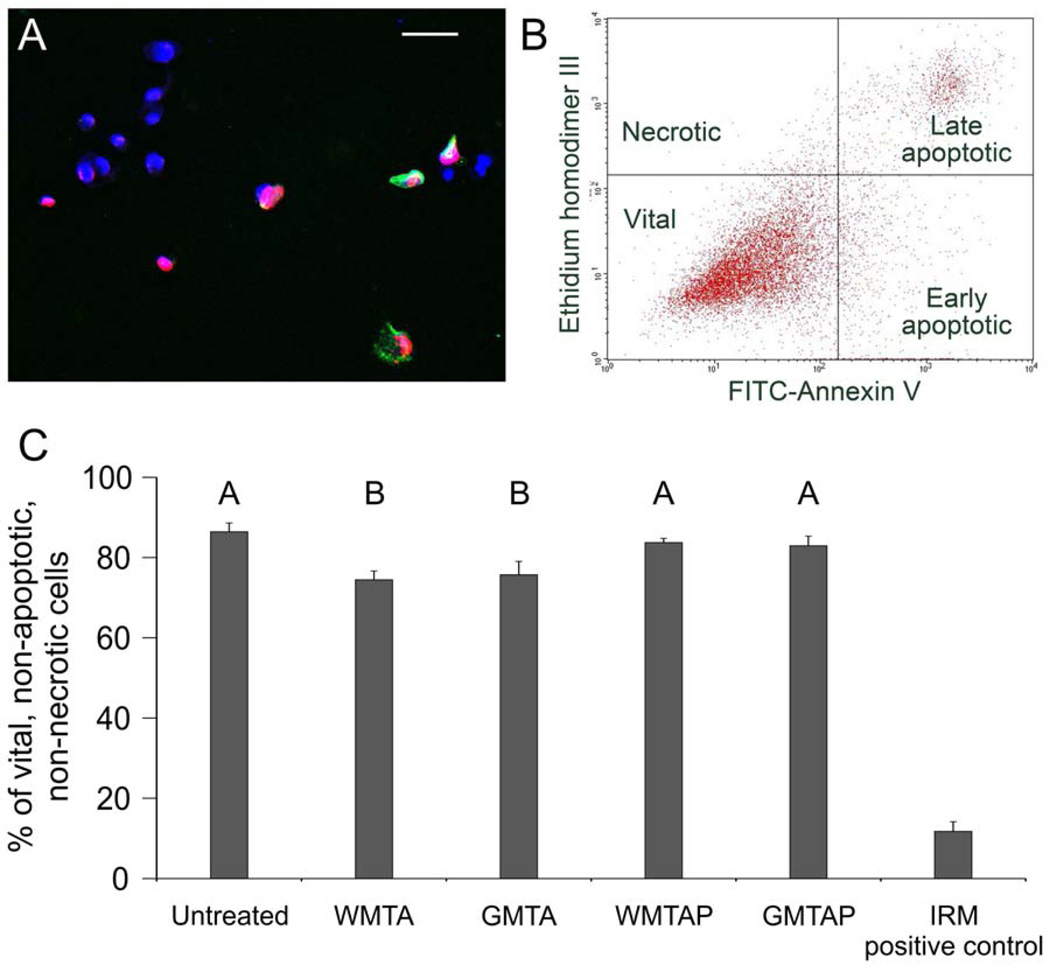
Figure 2.
(A) A representative CLSM image of MPDC-23 cells that were triple-stained with ethidium homodimer III (Etd; red-fluorescent non-vital DNA dye), Heoschst 33342 (blue-fluorescent nuclear counter-stain), and fluorescein isothiocyanate-annexin V (FITC-AnV; green-fluorescent phosphatidylserine-binding cytoplasmic dye) after their exposure to the test cements. Healthy cell nuclei are stained blue, apoptotic cells show green cytoplasm, necrotic cells show red or pink nuclei. (B) A representative 2-dimensional flow cytometry dot plot of the data derived from FITC-AnV and Etd-stained MDPC-23 cells after their exposure to test cements for 3 days. (C) A bar graph comparing the percentage of vital cells (lower left quadrant of Figure 2B) after exposure to the test cements (N = 3). Groups labeled with the same letter designators are not significantly different (P > 0.05).

