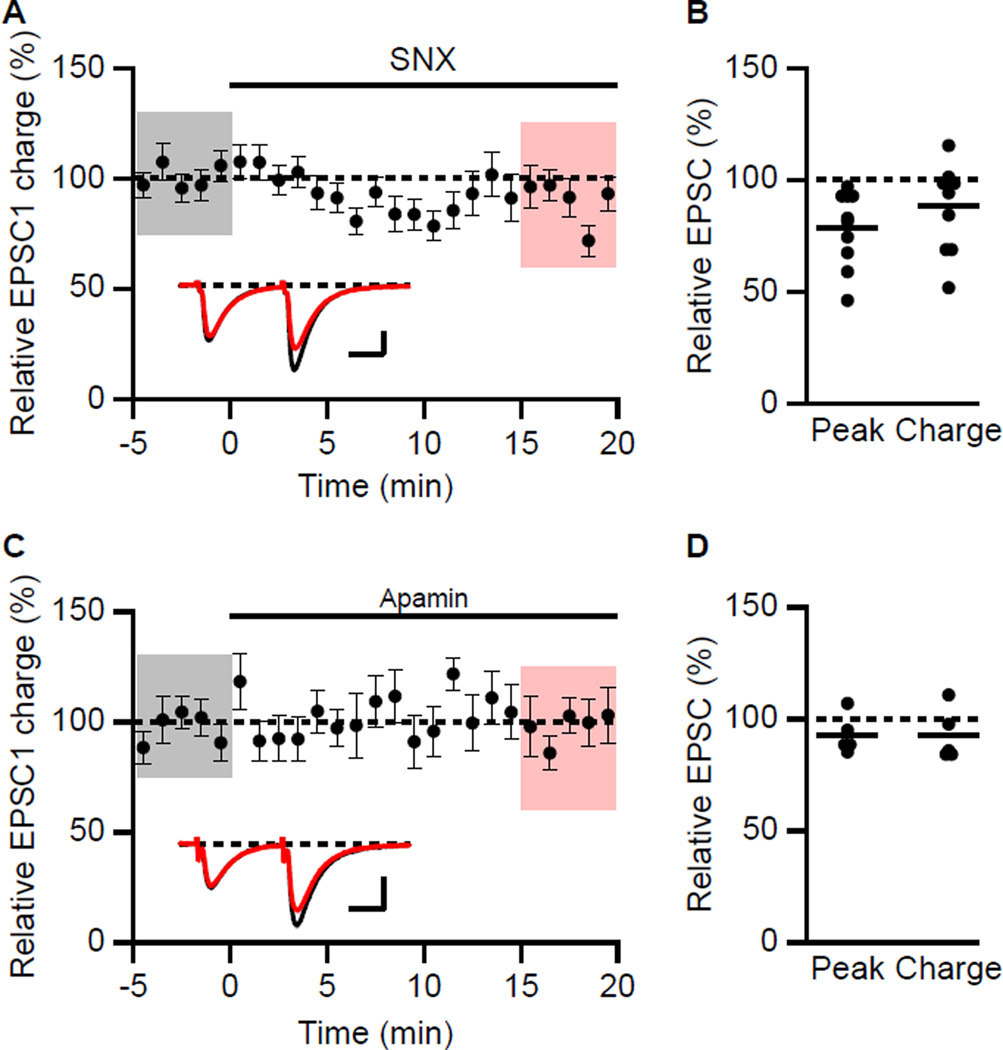
Figure 3. Effect of SNX on synaptic transmission in voltage clamp.
(A) Time course of the normalized charge transfer of the first EPSC (EPSC1) (mean ± s.e.m.) for baseline and during wash-in of SNX (n = 10). Insets: averaged of 15 paired EPSCs ± s.e.m. (shaded areas) taken from indicated shaded time points for baseline (black) and 15–20 min after wash-in of SNX (red). Scale bars: 50 pA and 20 ms. (B) Scatter plot of relative EPSC1 peak and charge in SNX compared to baseline from the individual slices in panel A. Horizontal bar reflects mean response. (C) Time course of the normalized charge transfer of the first EPSC (EPSC1) (mean ± s.e.m.) for baseline and during wash-in of apamin (n = 5). Insets: averaged of 15 paired EPSCs ± s.e.m. (shaded areas) taken from indicated shaded time points for baseline (black) and 15–20 min after wash-in of apamin (red). Scale bars: 50 pA and 20 ms. (D) Scatter plot of relative EPSC1 peak and charge in apamin compared to baseline from the individual slices in panel A. Horizontal bar reflects mean response.

