Figure 1.

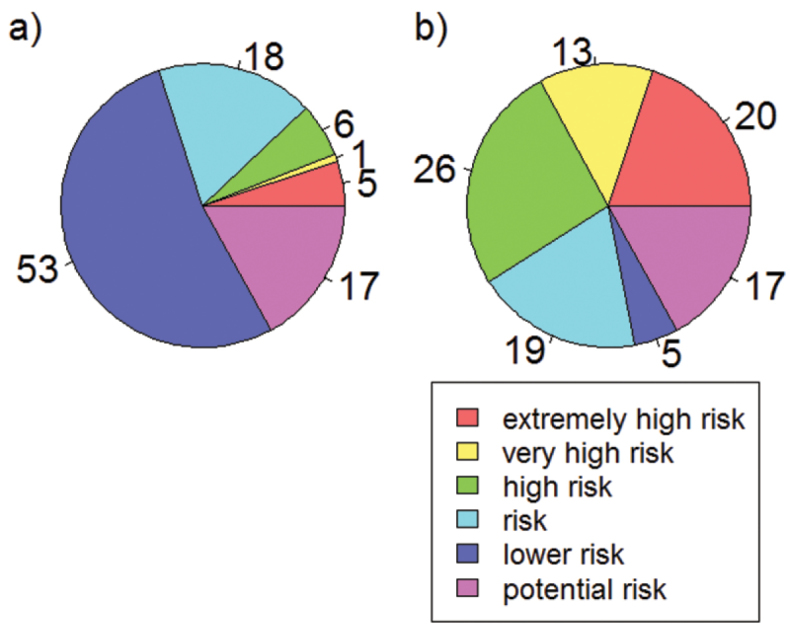
Proportion of species (%) with different climatic risk status after Settele at al. (2008) assuming full dispersal (a) and no dispersal capacity (b).

Proportion of species (%) with different climatic risk status after Settele at al. (2008) assuming full dispersal (a) and no dispersal capacity (b).